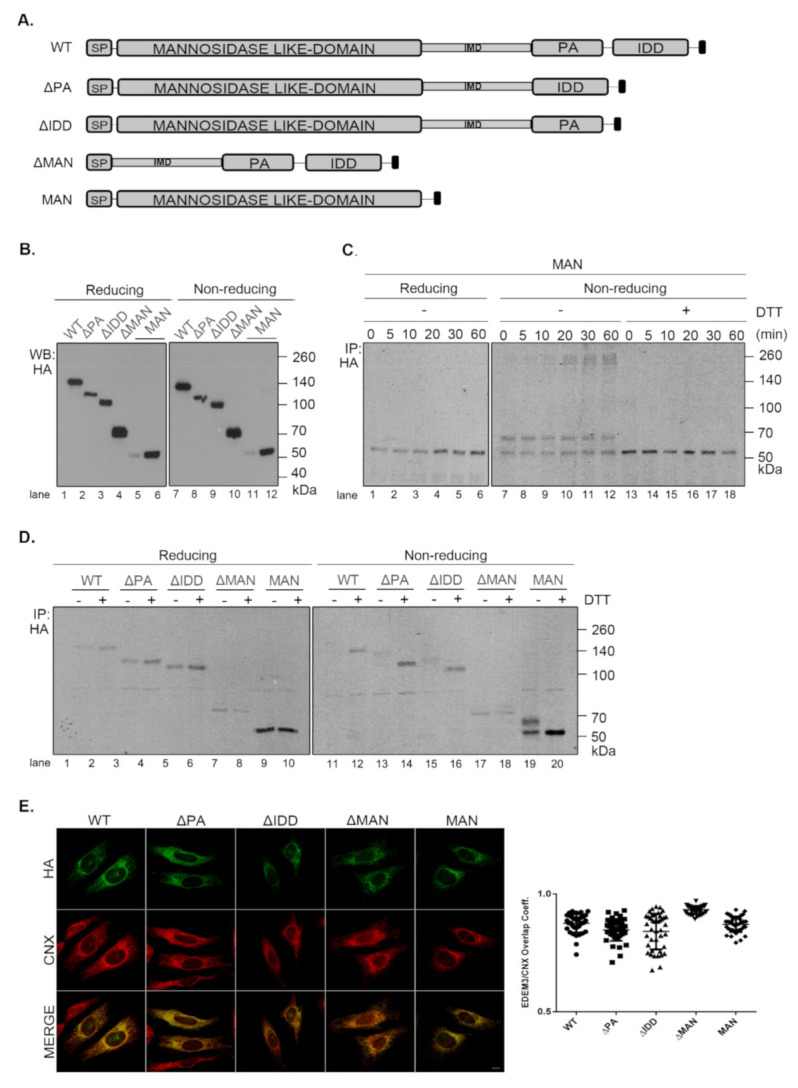
Figure 3.

Characterization of EDEM3 constructs. (A) Schematic representation of EDEM3 constructs. The SP notation denotes the signal peptide, while the black squares represent the KDEL. (B) EDEM3 constructs expression levels in EDEM3-KO cell line. Equal amounts of protein lysates were separated in reducing and non-reducing conditions and the expression level was tested by Western blotting. Given the low signal obtained for MAN (lane 5, 11) the DNA quantity used for transfection was doubled (lane 6, 12). (C) Redox sensitivity of the MAN construct determined by pulse chase analysis. DTT was added to the cell media to modulate the folding of the protein during the indicated time points. The immunocomplexes were separated in reducing and non-reducing conditions by SDS-PAGE and the results were visualized by autoradiography. (D) Same as in (C), except the cells were transfected to overexpress WT and all other EDEM3 mutants and harvested immediately after the pulse. (E) Colocalization of EDEM3 mutants with calnexin. HeLa cells were transfected with the EDEM3 mutants and processed for immunofluorescence with mouse monoclonal anti-HA and rabbit anti-calnexin (CNX) antibodies. The overlap coefficient was determined for 40 individual cells and represented as (mean ± SD).
