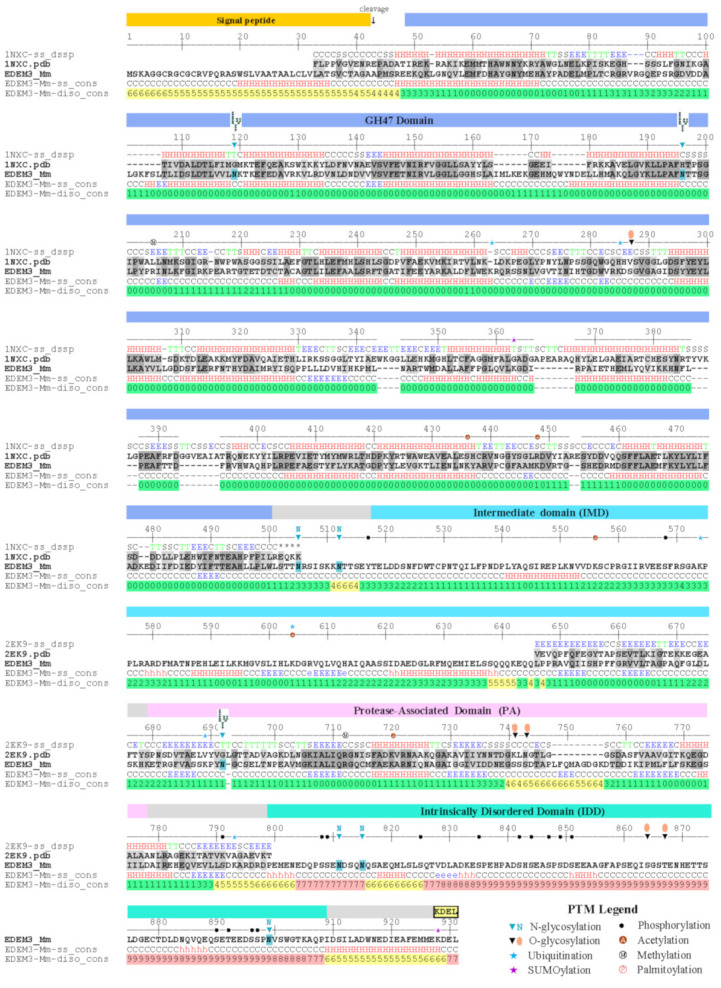
Figure A1.

Detailed domain organization, template alignment and structural profiling of EDEM3 sequence. EDEM3 sequence, secondary structure prediction and disorder prediction consensuses are shown on the last three rows, while the templates used in homology modelling are shown above (PDB: 1NXC, 2EK9). Intrinsic disorder propensity is shown on a scale of 0 to 9 (low 0–3 in green, medium 4–6 in yellow, and high 7–9 in red). The legend of the posttranslational modification (PTM) predicted sites (with over 50% probability) is also incorporated in the figure.
