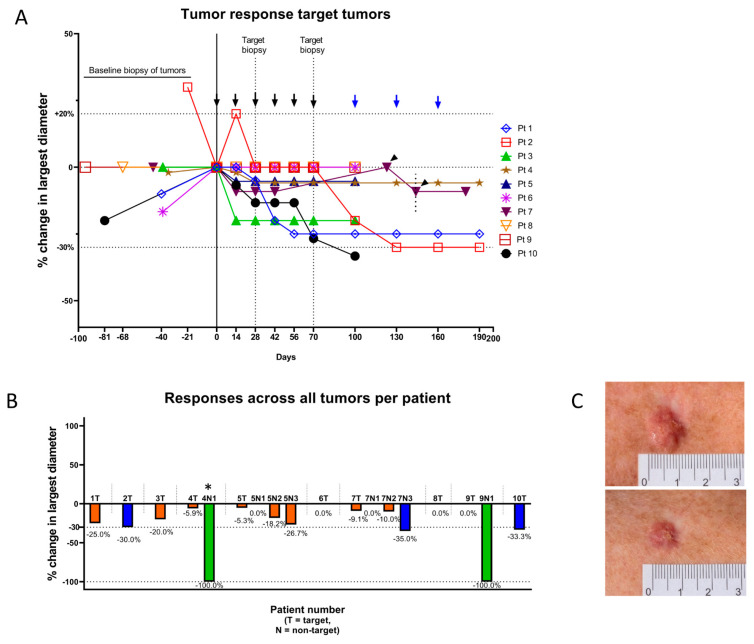
Figure 1.
Tumor responses in target tumors. (A) Spiderplot of percent change in largest diameter. Tumor sizes normalized at first vaccination (day 0). Patient #1, #6 and #10 had increasing sizes from diagnostic biopsy until initiation of vaccinations. Arrows indicate vaccination with IO103. Six vaccines were given to all patients, while an additional three vaccines (blue arrows) could be given in patients depending on response. Thus, at day 100, patients 1, 2 and 4 received seventh vaccination and proceeded to receive in total nine vaccines while the remaining patients were evaluated after their sixth vaccination. Patient #7 had a treatment break after the fourth vaccination during which the tumor increased until restart of vaccinations (arrowheads indicate patient #7′s fifth and sixth vaccination). (B) Percent change from baseline in largest diameter for all tumors. *: The non-target tumor on patient #4 was not measured but only photographically documented before clearance after eighth vaccination. (C) Example of PR: target tumor of patient #10. Top: At baseline. Bottom: At evaluation after six vaccinations.

