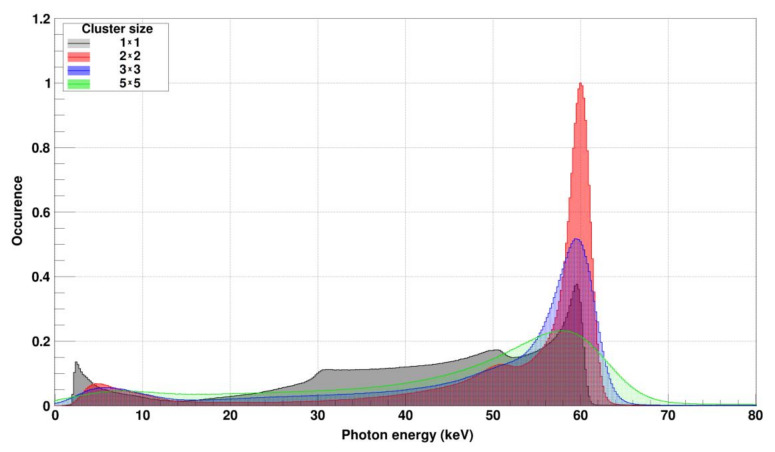
Figure 5.
Energy spectrum of 60 keV monochromatic photons measured with a GaAs:Cr sensor (2017) bump bonded to a JUNGFRAU readout chip. A cluster finder was used to identify photons and to center the cluster around the pixel with the highest signal. The gray spectrum uses only the information from the cen-tral pixel of the cluster (1 × 1), e.g., the pixel with the highest signal. Escape photons as well as a relatively high charge sharing tail are visible. The red spectrum is composed of the four pixels of the pixel cluster with the highest summed signal (2 × 2 cluster). In this case, the FWHM for the whole pixel matrix is 2.58 keV or 4.3%. The blue spectrum uses the summed signal from the central pixel plus its eight neighbors (3 × 3 clus-ter), the green spectrum the information from a 5 × 5 pixel cluster centered around the pixel with the highest signal. (The increase of the photo peak width with bigger clusters is due to the higher number of pixels and thus their summed up noise contributions using clustering).

