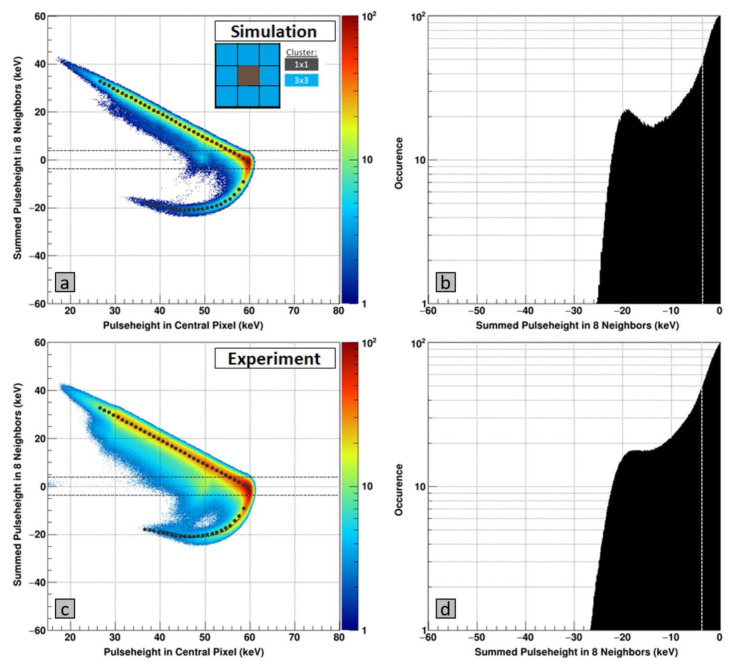
Figure 7.
(left) Correlation plots of monochromatic 60 keV photons showing the sum of the signals in the 8 adjacent pixels (y-axis) as function of the signal in the central pixel (x-axis) of a 3 × 3 cluster. The horizontal black dotted lines represent the selection criteria of ±3 × the noise of the eight neighboring pixels. (a) Correlation plot generated from a simulated dataset using the following parameters: τe = 120.0 ns, μe = 4000 cm2/(V·s), τh = 2.5 ns, μh = 200 cm2/(V·s). The gray points indicate the fitted value of the summed pulse height in the eight neighboring pixels. (c) Correlation plot generated from experimental data. The gray points indicate the fitted value of the summed pulse height in the eight neighboring pixels for the simulated dataset. (right) Projection of the negative signal tail of the correlation plots. The gray vertical line indicates –3× the noise of the eight neighboring pixels, i.e., all events left of this line are considered as crater hits (b) Simulation and (d) Experimental data.

