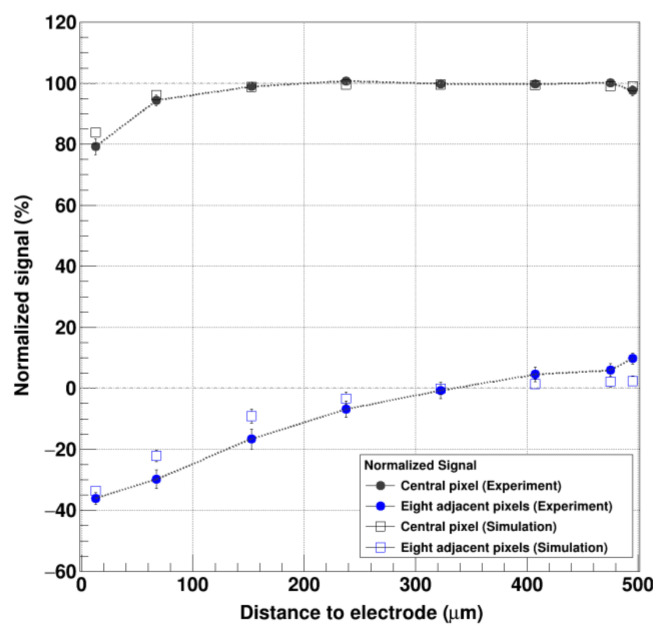
Figure 12.
Comparison of the experimental and simulated data of the angle-on measurement: (Black solid indicator: experimental data/black square: simulated data) Signal in the central pixel of a 3 × 3 cluster as function of the absorption distance from the electrode. (Blue solid indicator: experimental data/blue square: simulated data) Signal in the eight adjacent pixels.

