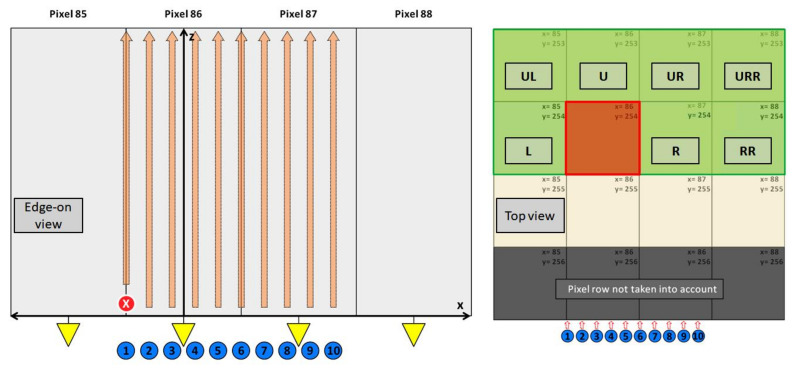
Figure 13.
(left) Diagram of the edge-on measurement. The pixel rows 86 and 87 have been raster scanned with a focused 40 keV photon beam with a granularity of Δx = 15 µm (10 scan points) and a Δz = 10 µm (60 scan points). (right) The plot shows the top view on 4 × 4 pixels (x = 85–88 and y = 253–256). By using a photon finder algorithm only photons that were absorbed in the pixel row 254 were taken into account to avoid sensor corner effect. The response maps of the adjacent pixels were created, indicating the response of a pixel depending on the interaction point in the pixel under investigation (86, 254). As example, the plot indicates the assignment, when the photon absorption happens in pixel (86, 254) (red square). The letters indicate the following pixels (w.r.t. the pixel under investigation): L—left pixel, R—right pixel, RR—2 × right pixel, UL—upper left pixel, U—upper pixel, UR—upper right pixel, URR—upper 2 × right pixel. During the experiment two pixels have been scanned, namely (86, 254) and (87, 254).

