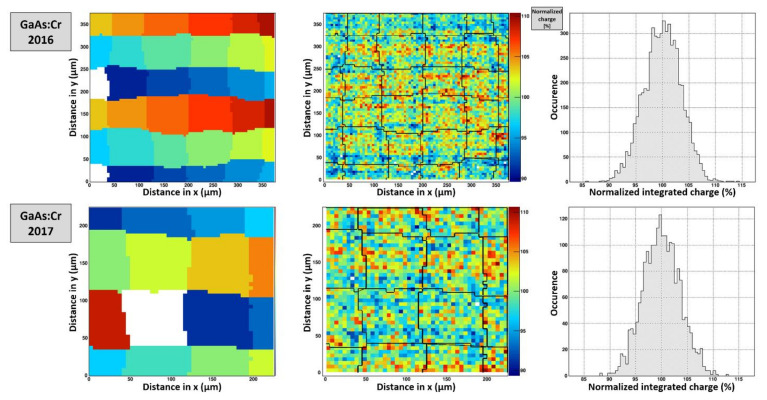
Figure 19.
(left) The left plots show the merged pixel response map. At each scan point, the pixel with the highest charge is assigned as collecting pixel. (center/right) Charge collection map and histogram indicating the overall collected charge in all pixels for each scan point. The black lines are the overlaid pixel boundaries extracted from the photon counting representation (with an estimated error margin of ±5 μm).

