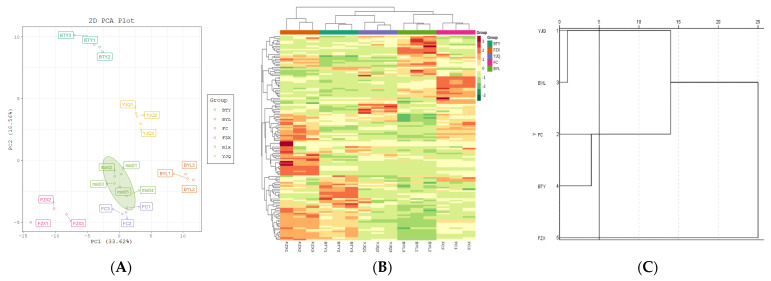
Figure 4.
PCA score plot and cluster map of polyphenol metabolites in different litchi cultivars. (A) PCA score plot; (B) Cluster heat map. The color sequence from red to dark green indicates metabolites abundance from high to low; (C) Cluster analysis chart, genealogy using average join (between groups), rescaled distance clustering combination.

