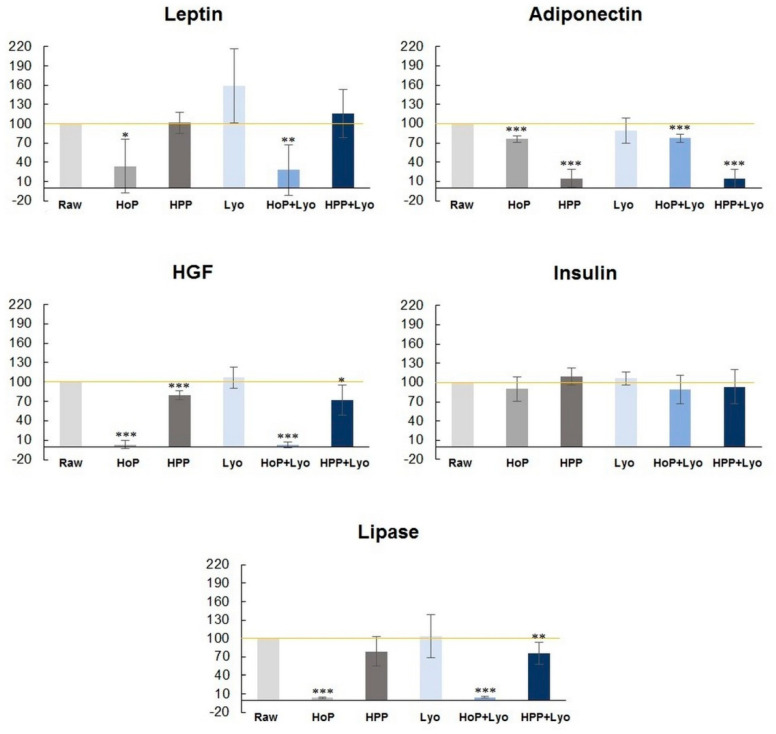
Figure 2.
Changes in leptin, adiponectin, hepatocyte growth factor (HGF), insulin, and lipase concentrations (%) in processed human milk versus raw milk (Raw) (100%). The data are presented as mean values with the standard error of the mean. The percentage of the concentrations of the selected bioactive components in milk samples subjected to Holder pasteurization (HoP), high-pressure processing (HPP), freeze-drying (Lyo), HoP + Lyo, and HPP + Lyo (at time 0) compared to raw human milk (100%). Statistically significant differences are marked with asterisks, depending on the degree of significance: *** p < 0.0001, ** p < 0.001, * p < 0.05.

