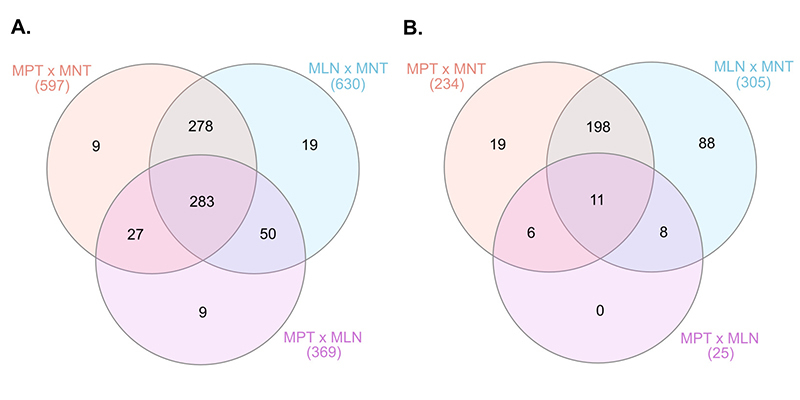
Figure 1 -. Venn diagrams of the differentially expressed proteins observed among the comparisons of the MPT x MNT, MLN x MNT and MPT x MLN groups of samples of the male patient. A. Number of all proteins identified as differentially expressed among the groups’ comparison. B. Number of up-regulated and down-regulated proteins (log2-fold change cut-off 1.5) observed among each group comparison. MPT, male-primary breast tumor; MNT, male-non-tumor breast tissue; MLN, male-axillary metastatic lymph node.

