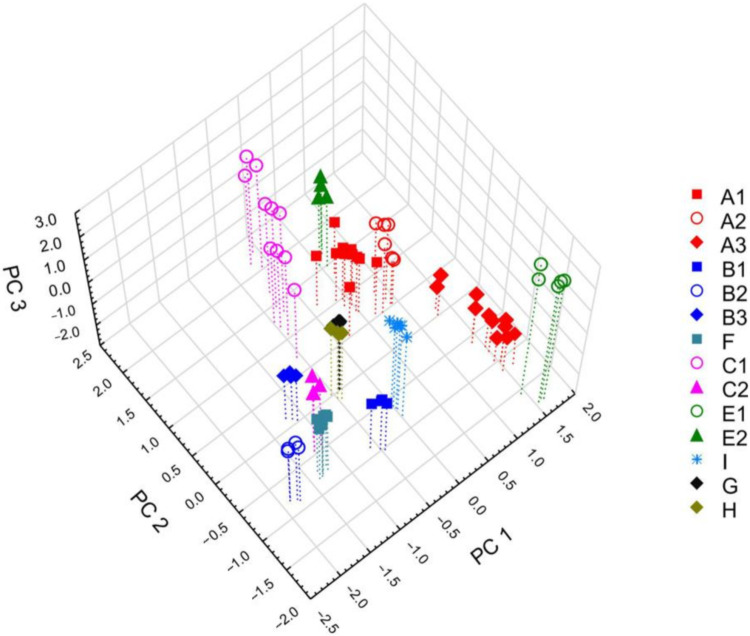
Figure 2.
Three-dimensional PCA score scatter plot based on all of the detected compounds in samples of cryptic species of A. pinguis (C, E, G, H, and I). The percentage of explained variance (R2X) was 81.4% for PC1, 6.2% for PC2, and 4.3% for PC3, and the predictive ability (Q2) was 36.7%, 16.7%, and 19.9%, respectively. Species in this study were compared with the remaining species of A. pinguis examined in a previous study [35].

