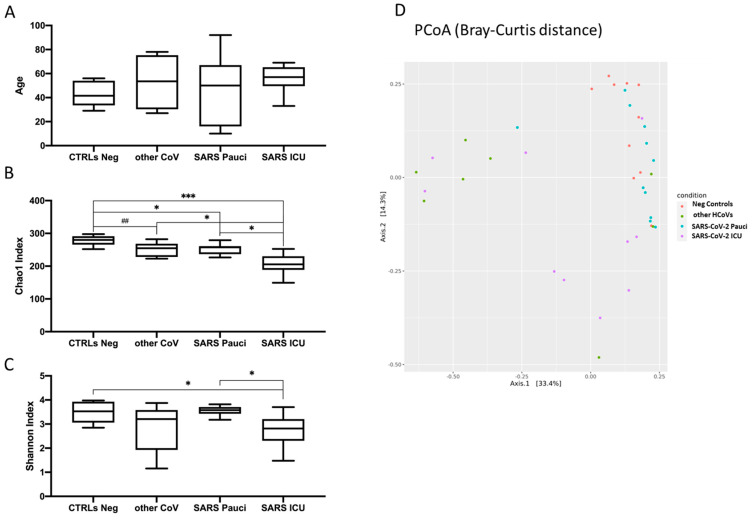
Figure 1.
Boxplots of age (A), Chao1 index of species richness (B) and Shannon index of species diversity (C) in healthy subjects (Neg Controls), patients infected with other human coronaviruses (Other HCoVs), paucisymptomatic patients (SARS-CoV-2 Pauci) and patients in Intensive Care Units (SARS-CoV-2 ICU). (## = p < 0.10; * = p < 0.05; ** = p < 0.01; *** = p < 0.005). (D) Multidimensional Scaling plot from Principal Coordinates Analysis (PCoA) based on Bray–Curtis distances at genus level showing a clustering pattern among samples obtained from Neg controls (red), other HCoVs (green), SARS-CoV-2 Pauci (blue) and SARS-CoV-2 ICU (violet).

