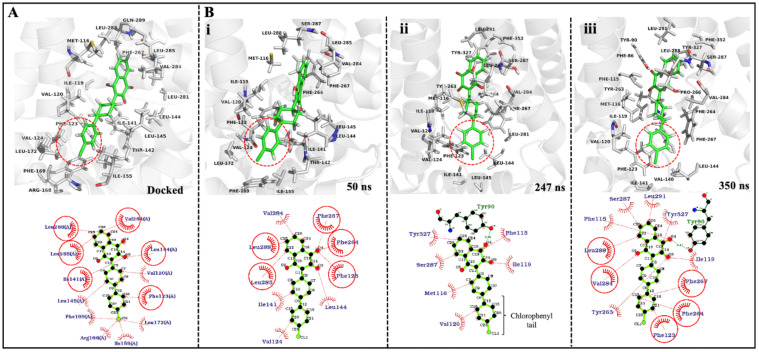
Figure 5.
3D and 2D ligand interactions of ATQ drug in docked pose and across different time steps during 350 ns simulations. (A) ATQ docked pose and its interaction within 5 Å radius around ATQ drug in the PfCytb-ISP Qo active site pocket; ATQ in green while active site residues in gray. (B) ATQ-bound protein and ATQ interactions during three time steps of the MD simulation. The 3D figures show Qo active site pocket of PfCytb-ISP protein in gray while ATQ drug is shown in green as stick representation in both 3D and 2D representation. Red dotted circle represents the chlorophenyl tail of the ATQ drug.

