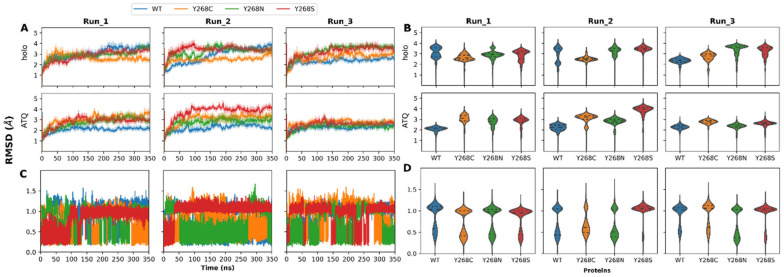
Figure 6.
Molecular dynamics trajectory analysis of the changes to protein root mean square deviation (RMSD) both in the holo and ATQ bound systems. (A) Protein RMSDs over the 350 ns simulation; (B) Protein RMSD violin plot showing conformational distribution and sampling; (C) Ligand (ATQ drug) RMSD over the 350ns simulation; (D) ATQ RMSD violin plot presenting conformational sampling and distribution.

