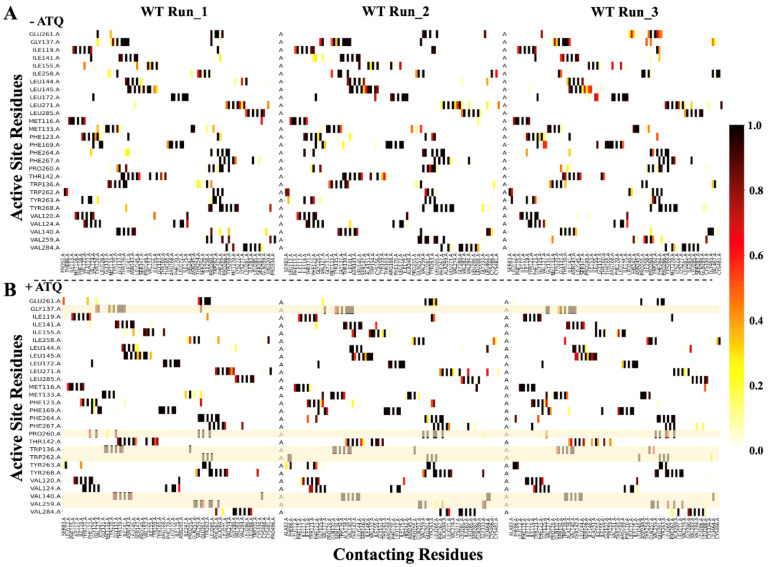
Figure 8.
Residue contact heat maps for PfCytb-ISP active site residues. Heat map representations of the active site residues forming contacts with other residues (contacting residues) in (A) WT (wild-type) system across triplicate runs in holo protein structure and (B) WT system across triplicate runs in ATQ-bound protein structure. The residue contacts were monitored over during the last 100 ns of the simulation time. The yellow lines across the heatmaps in (B) highlight residues of either reduced or lost contacts relative to the WT. Color intensity is proportional to the occurrence of residues contact throughout the simulation, i.e., 0–1 on the color bar is equivalent to 0–100% MD simulation time. Zoomed figures comparing each of the mutant systems to WT in both holo and ATQ-bound forms are shown in Figures S6–S8.

