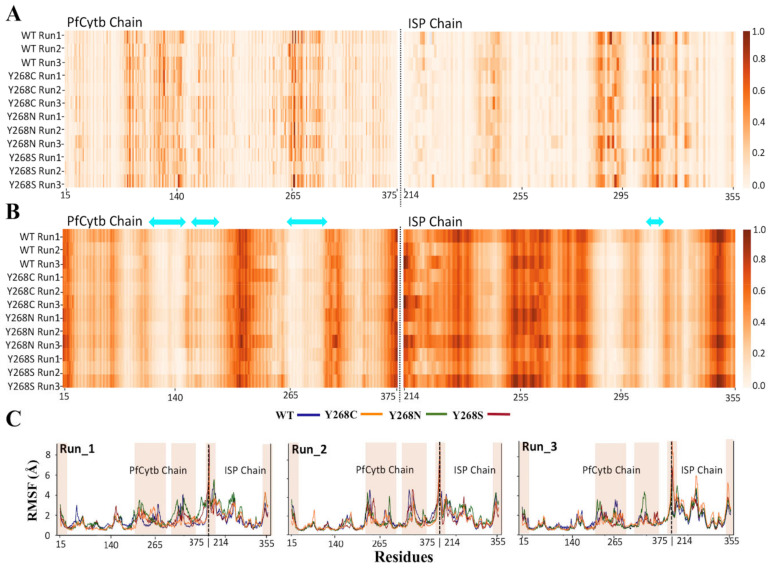
Figure 9.
Dynamic residue network (DRN) analysis. Heat map representation of normalized values of (A) Betweenness centrality (BC) and (B) Average shortest path (L) for PfCytb and ISP chains. L values were correlated with root mean square fluctuation (RMSF) which is plotted in (C) where the WT (wild-type) and mutant systems Y268C, Y268N and Y268S are represented by the blue, orange, green and red lines, respectively. (C). Black dotted lines in RMSF plots show an intersection between the two chains. Two-sided cyan arrow on the L heat map represents active site residues. Each protein system had triplicate runs presented in (A–C).

