
Figure 5.
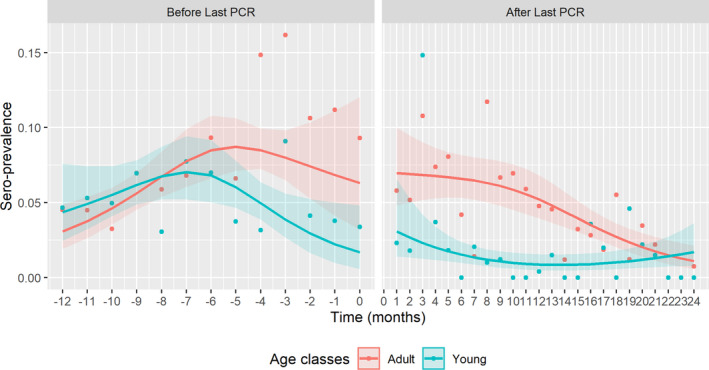
Results of GEE model, displaying the seroprevalence in different age classes in the months before and after the last PCR‐positive sample in Estonia
- Time point 0 = moment of detecting last PCR‐positive sample in particular LAU 1 region.