
Figure 7.
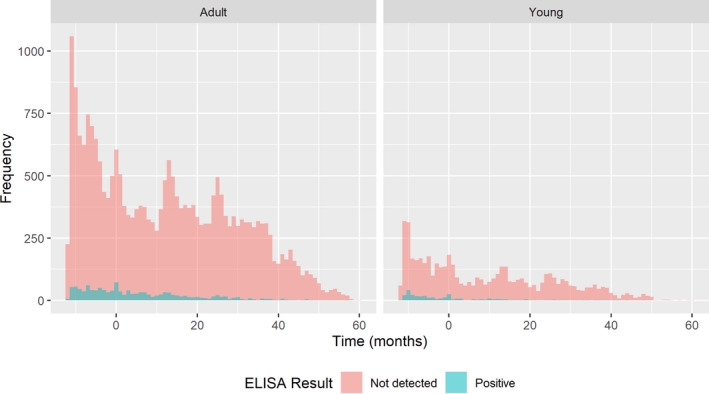
Frequency of samples that were tested with ELISA in pooled LAU 1 regions since the last PCR‐positive sample in the LAU regions in Latvia
- Time point 0 = moment of detecting last PCR‐positive sample in particular LAU 1 region.