
Figure 17.
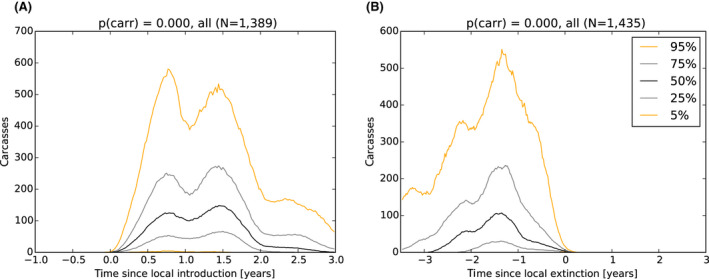
Temporal dynamics of the number of carcasses attributable to ASF infection that were present in the environment in simulated wild boar populations in Estonia at the LAU 1 unit Variation over time between simulated runs and different LAU 1 units is presented using percentiles. The data represent the actual number of carcasses present after accounting for time to decomposition, and not the weekly incidence. Data are aligned by the week of the first ASF incursion (A), and date when the last infectious animal had succumbed (B), per LAU 1 unit (t = 0). The data series comprise 100 runs and 13 LAU 1 units. The simulation was conducted over the full territory of Estonia (except islands).