
Figure 19.
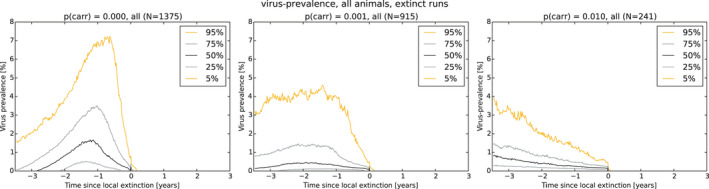
Temporal dynamics of virus (PCR+) prevalence in simulated wild boar populations in Estonia at the LAU 1 unit level
- Variation over time between simulated runs and different LAU 1 units is presented using percentiles. Data are aligned by the week that the last infectious animal succumbed to ASF, per LAU 1 unit (t = 0). Left: standard model, no animals develop lifelong infectivity; Middle: 1 out of 1,000 infected animals develops lifelong infectivity; and Right: 1 out of 100 infected animals develops lifelong infectivity. Weekly prevalence was calculated given the present population number (i.e. number of animals alive). Of the original data series (comprising 100 runs and 13 LAU 1 units), only those simulation runs in which fade‐out occurred are presented here. The simulation was conducted over the full territory of Estonia (except the islands). Additional plots are presented in Lange et al. (2021), including the numbers of virus positives.