
Figure 22.
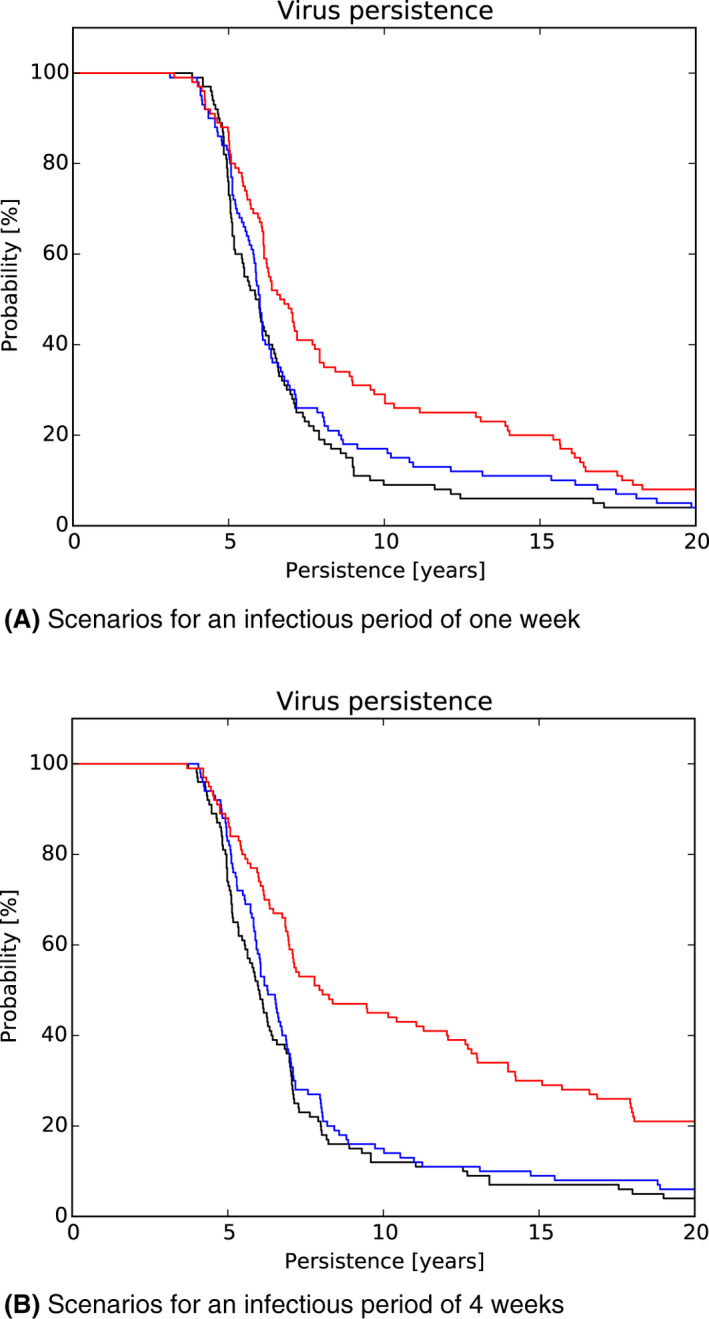
Duration of ASFV infection in simulated wild boar populations of Estonia under differing assumptions about case‐fatality rate and the duration of transient period of infectivity among surviving animals
- The simulations compare the standard model (black line, transient infections 5%) with scenarios assuming greater case survival (blue line 10%; red line 20%). Additionally, the transiently infected animals had an infectious period of either 1 week (A) or 4 weeks (B). Fade‐out graphs show the proportion of simulation runs that still contained either infectious animals or carcasses attributable to ASF infection (y‐axis) if the infection was introduced in the simulation area at t = 0 (x‐axis).