
Figure 23.
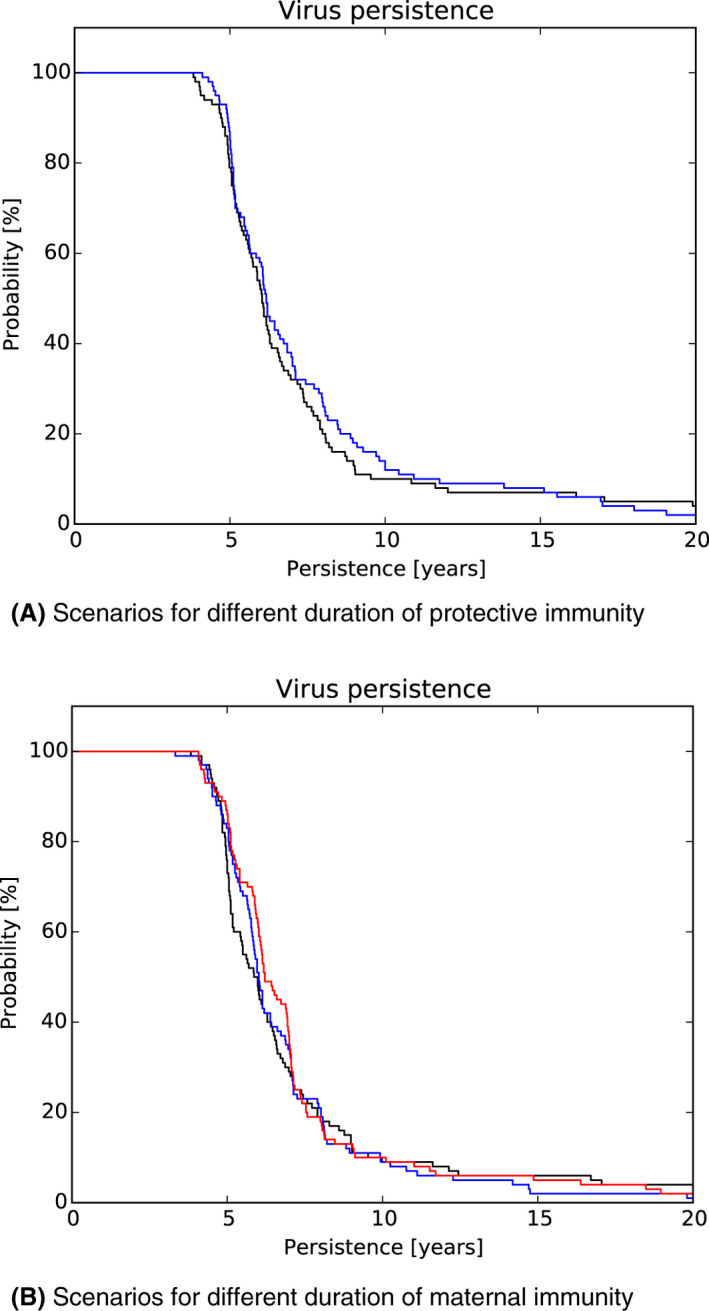
Duration of ASFV infection within simulated wild boar populations of Estonia under differing scenarios relating to protective immunity in animals surviving ASFV infection (A) and duration of protective maternal immunity in young animals (B)
- Fade‐out graphs show the proportion of simulation runs that still contained either infectious animals or carcasses attributable to ASF infection (y‐axis) if the infection was introduced in the simulation area at t = 0 (x‐axis).