
Figure 24.
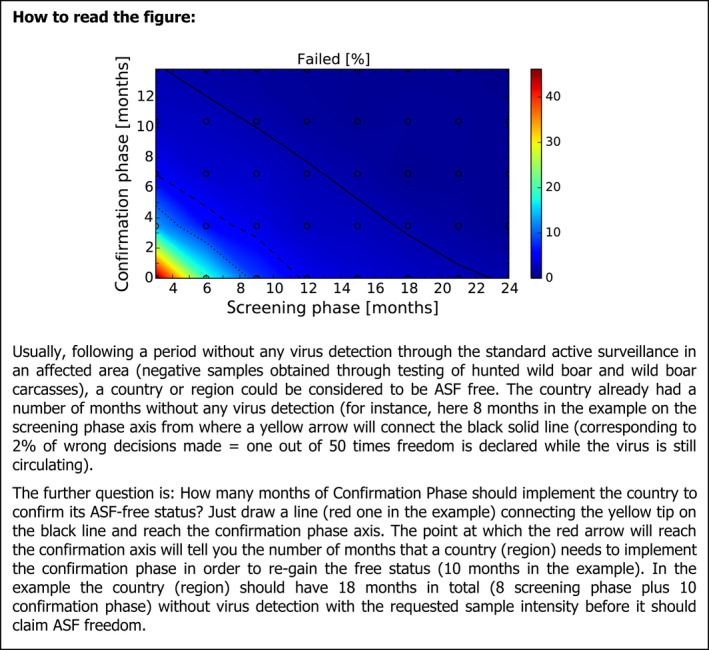
Standard model output following the evaluation of a two‐phase Exit Strategy
- The failure rate is presented given differing monitoring periods during the Screening and Confirmation Phases. The surveillance effort was 1 carcass per 1,000 km2 per year during the Screening Phase (x‐axis) and 2 carcasses (doubled intensity) during the Confirmation Phase (y‐axis). The colours represent the percentage of trials in which the Exit Strategy would have failed, i.e. obtaining a false‐negative result by proposing freedom from ASF while (undetected) infectious objects were still present in the simulation area. Lines show isoclines for failure rate of 2% (solid), 5% (dashed) and 10% (dotted). The random spread scenario ignores the human translocations that were observed in Estonia during 2015–2018 (EFSA, 2018).