
Figure 25.
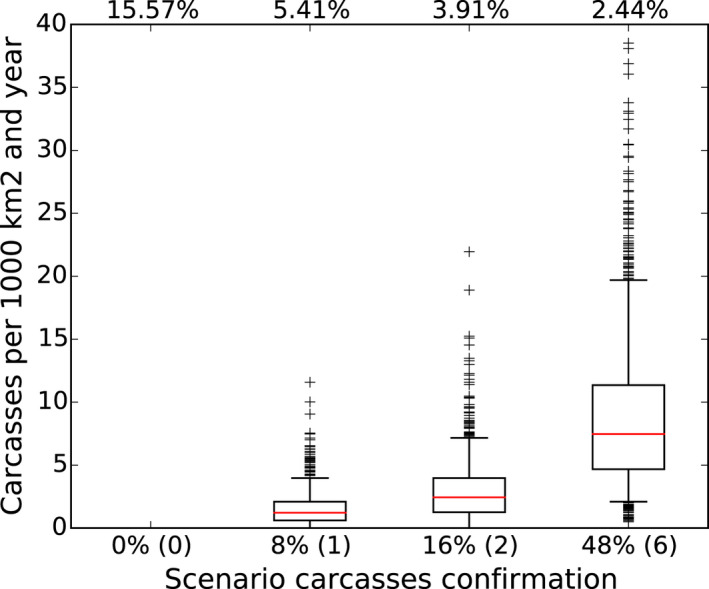
Comparison of different Exit Strategy options given different level of passive surveillance during the Confirmation Phase
- The scenario replicates 1 carcass collected per year and 1,000 km2 in the Screening Phase, but varies the intensity of carcass detection during the Confirmation Phase (bottom legend), namely 0, 1, 2 or 6 carcasses per 1,000 km2 per year (corresponding to 0%, 8% 16% and 48% carcass detection probability). The box plots present the variation in the number of carcasses that were actually collected in LAU 1 units and across model runs. The data are shown only for one specific combination of monitoring periods: Screening Phase of 6 months, Confirmation Phase of 7 months (a total of 13 months). At the top of the figure, the resulting strategy performance is shown in terms of the probability of a false decision.