
Figure 26.
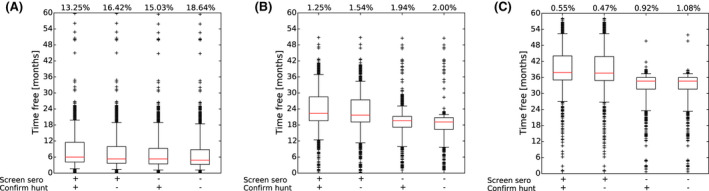
Comparison of different strategy options given differing levels of active surveillance during the Screening and Confirmation Phases
- Box plots reflect either the inclusion or omission of active sampling of subadults for serology during the Screening Phase (sero+, done; sero−, omitted) and of any active surveillance during the Confirmatory Phase (hunt+, all tested for viral genome and antibody; hunt−, no shot animals are tested). The box plots present a summary of the length of time that a LAU 1 unit was free of ASFV infection before the Exit Strategy came to a decision for that LAU 1 unit. The data are shown only for specific combinations of monitoring periods during the Screening or Confirmation Phase: (A) 3 + 4 (a total of 7) months; (B) 12 + 11 (23) months; (C) 24 + 14 (38) months. At the top of the figures, the resulting strategy performance is shown in terms of the probability of a false decision.