
Figure 27.
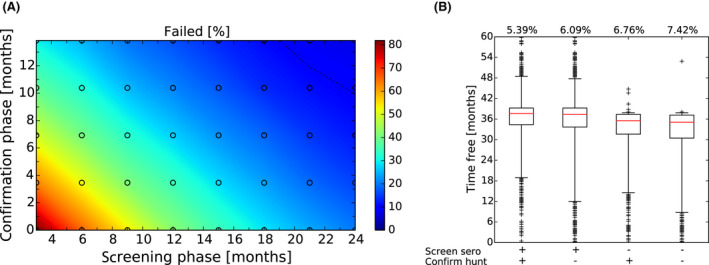
Exit Strategies
- (A) Model outcome of different parameterisations of an Exit Strategy in terms of failure rate assuming 1 lifelong carrier animal for every 100 ASF‐infected wild boar. The surveillance effort was 1 carcass per 1,000 km2 per year during the Screening Phase (x‐axis) and 2 carcasses (doubled intensity) in the Confirmation Phase (y‐axis). The colours represent the percentage of trials in which the Exit Strategy would have failed, i.e. obtaining a false‐negative result by proposing freedom from ASF while (undetected) infectious objects were still present in the simulation area. Lines show isoclines for failure rate of 2% (solid), 5% (dashed) and 10% (dotted). The random spread scenario takes account of the human translocations that were observed in Estonia during 2015–2018 (EFSA, 2018). (B) Comparison of different Exit Strategy options given differing levels of active surveillance during the Screening and Confirmation Phases. Equivalent to Figure 23C for the maximum considered monitoring periods of 24 + 14 months, but assuming 1 in 100 surviving animals being lifelong in an infectious carrier status.