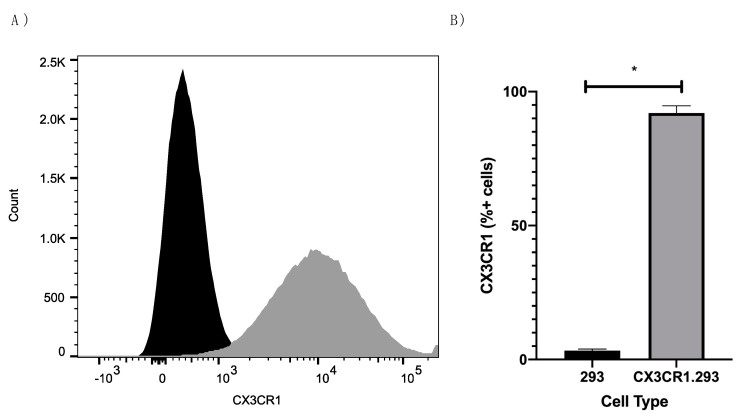
Figure 5.
CX3CR1.293 cells abundantly express CX3CR1. Representative histogram (A) and percentages (B) of CX3CR1 expression in 293 (black) and CX3CR1.293 (gray) cells after staining with anti-CX3CR1-Alexa647. 20,000 events were collected. Bars represent the mean of three independent experiments + SEM where * p < 0.001 by two-tailed T test.

