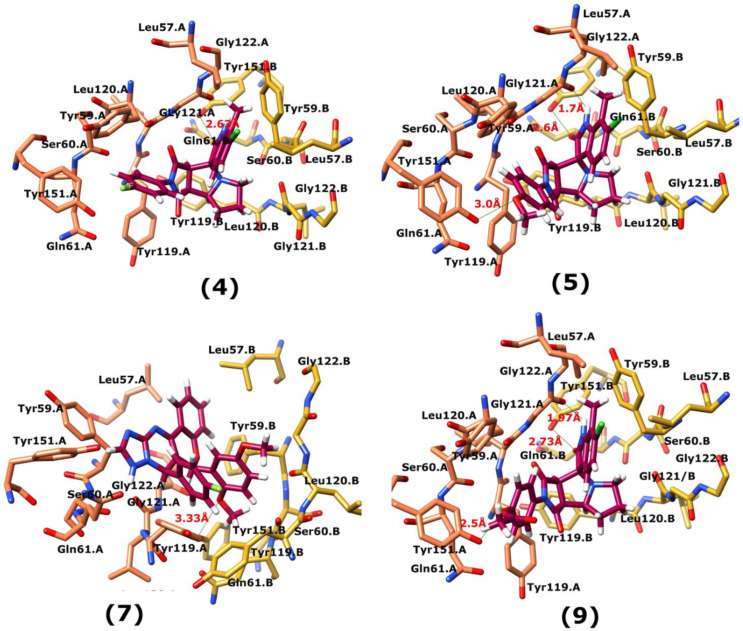
Figure 5.
The binding interactions of compounds 4, 5, 7 and 9. The interacting residues of chain A and B are depicted in Coral and Yellow color, respectively. The compounds are shown in magenta color (stick model). Hydrogen bonds are presented in green lines. The H-bond distances are labelled in red color. Compound’s numbers are written in parenthesis.

