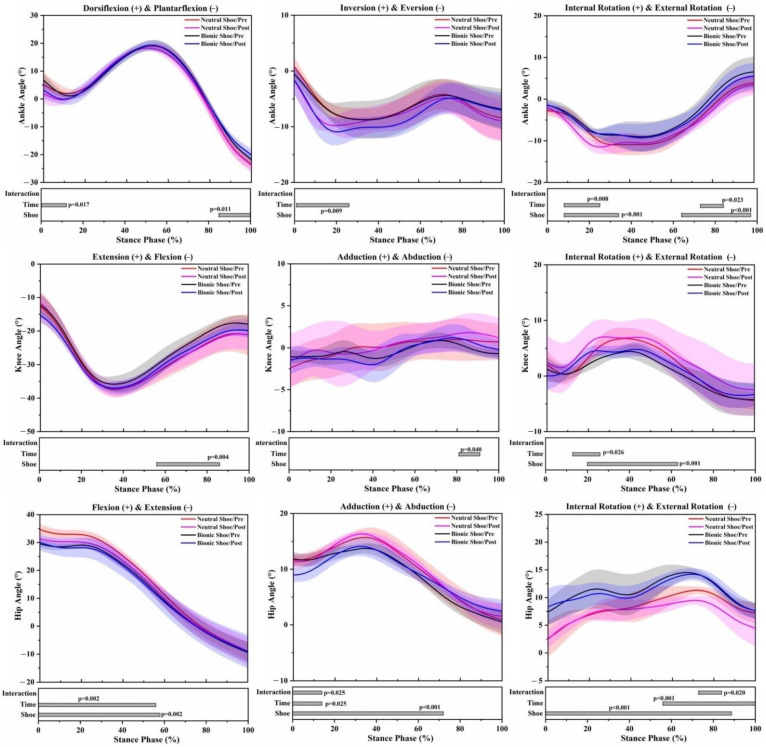
Figure 3.
Lower limb joint angle waveforms of mean and standard deviation over the stance phase of 4 running conditions. Significant main effects of the shoe, time and interaction (p < 0.05) are highlighted (grey horizontal bars at the bottom of the figure) during corresponding periods from SPM1d analyses.

