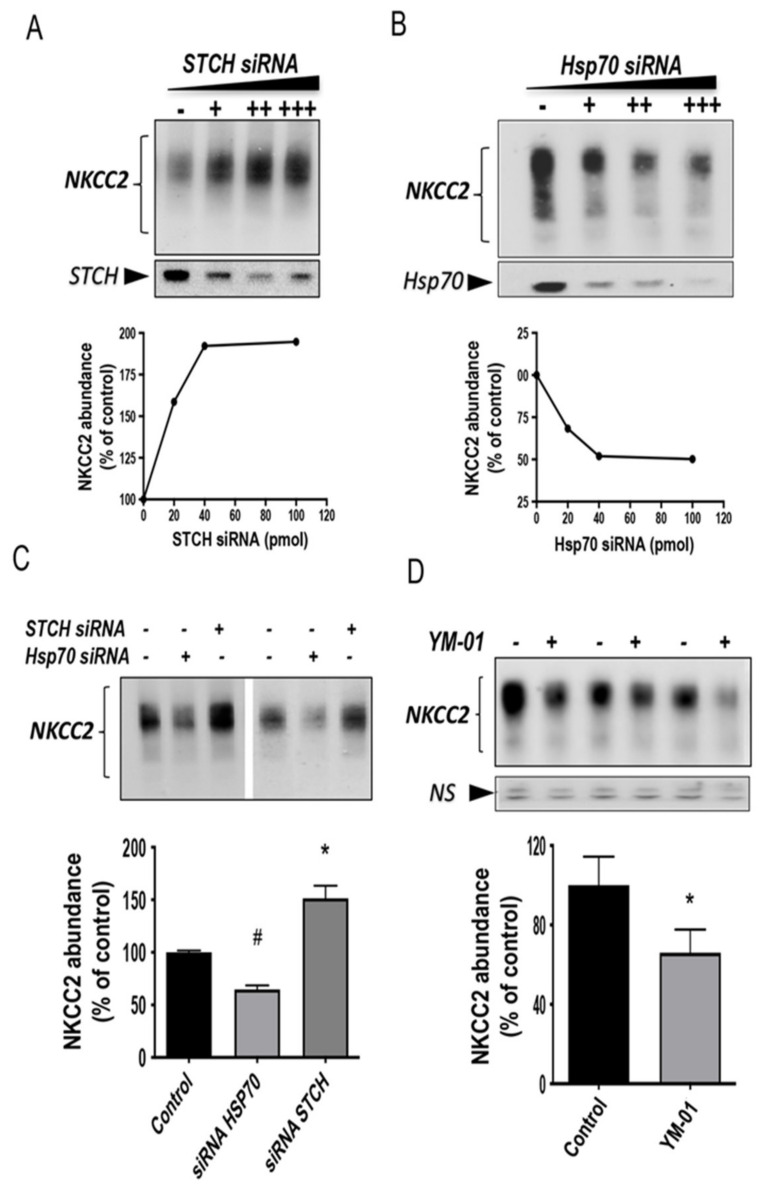
Figure 8.
Differential regulation of NKCC2 expression by endogenous Hsp70 and STCH. (A,B) Knockdown of endogenous STCH or Hsp70 in HEK cells regulate total NKCC2 protein abundance in a dose-dependent fashion. Upper panels, representative immunoblot analysis of two independent experiments illustrating the effect of STCH knockdown (upper left panel) or Hsp70 knockdown (lower right panel) on NKCC2. HEK cells were transfected with NKCC2 in the absence (-) or presence of an increasing amount (+, ++, +++) of specific STCH siRNA or Hsp70 siRNA. 48 h post-transfection, total cell extract from each sample was run on a parallel SDS gel and Western blotted for total NKCC2 expression. NKCC2 proteins were detected by immunoblotting with Myc antibody. Lower panels, densitometric analysis of total NKCC2 proteins. Data are expressed as percentage of control (n = 2). (C) Opposite effects of STCH and Hsp70 knockdowns on total NKCC2 protein. Representative immunoblot analysis showing the effect of Hsp70 knockdown and STCH knockdown on total NKCC2. HEK cells were transfected with NKCC2 in the absence (−) or presence of specific Hsp70 siRNA (+) or STCH siRNA (+). Then, 48 h post-transfection, total cell extract from each sample was subjected to immunoblotting analysis. Lower panel, densitometric analysis of total NKCC2 proteins. Data are expressed as percentage of control. Each point represents mean ± SE from four independent experiments (n = 4). #, p < 0.05 versus control. *, p < 0.003 versus control. (D) Effect of Hsp70 inhibitor YM-01 on NKCC2. HEK cells transfected with NKCC2 were treated with 1 μM of YM-01 (+) or without (−) overnight before cell lysis and immunoblotting using anti-Myc for NKCC2. NS, a non-specific band illustrating the equal loading of protein extracts. Lower panel, densitometric analysis of total NKCC2 proteins. Data are expressed as percentage of control. Each point represents mean ± SE from three independent experiments (n = 3). *, p < 0.05 versus control.

