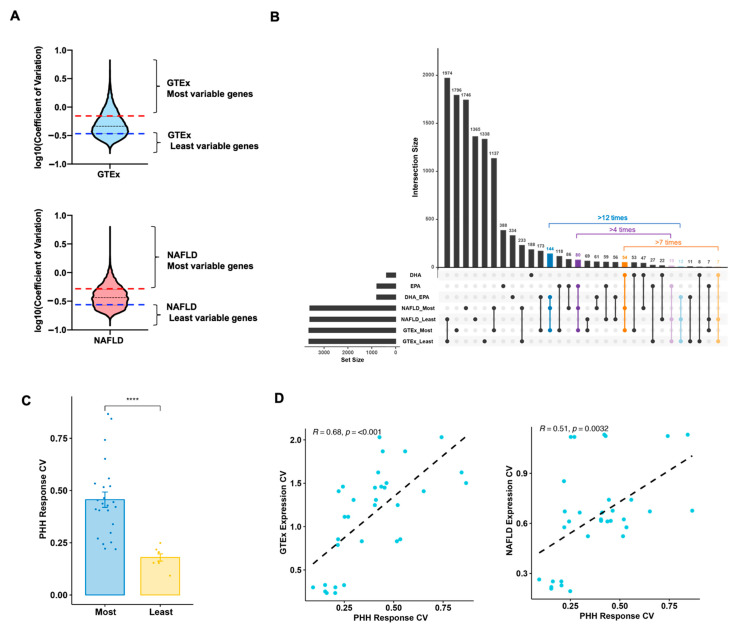
Figure 4.
Selection of biomarker genes contributing to individual variation in hepatic response to DHA/EPA. (A) Defining genes with most or least expression variability in general (GTEx) or relevant disease (NAFLD) populations. (B) Selection of signature genes displaying high population expression variability in general (GTEx) and relevant metabolic disease (NAFLD) populations, while signature genes with least population expression variability in human populations served as negative controls. Here, the UpSet plot summarized the intersections of each group of signature genes and the most or least variable hepatic genes in general/relevant disease populations. (C) Response coefficient of variation (CV) for signature genes with high expression variability was significantly higher than those exhibiting low expression variability in human populations. Coefficient of variation was calculated to represent the response variability based on their responses across a panel of 10 donors. **** p < 0.001, two-tailed unpaired Student’s t-test was performed to compare most variable versus least variable signature genes. (D) Correlation of coefficient of variation between the expression in general/relevant disease populations and responses in PHH (Primary human hepatocytes) were plotted.

