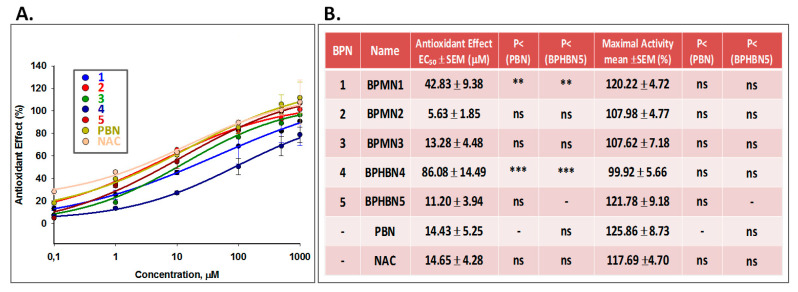
Figure 9.
Antioxidant effect of BPNs 1–5, PBN, and NAC after I/R in human neuroblastoma SH-SY5Y cells. (A) Dose–response curves showing the percentage of antioxidant effect of different compounds at the indicated concentrations. The curve adjustments to estimate the EC50 were carried out by non-linear ponderated regression analysis of minimal squared, using logistic curves f1 = min+(max-min) /(1+(x/EC50)^(-Hillslope). Data represent mean ± SEM of three experiments, each one done in triplicate (n = 3). The analysis was implemented using the software SigmaPlot v.11. (B) EC50 values and maximal antioxidant activities for the indicated compounds. The statistics compares the differences between EC50 or maximal activities values for different compounds tested against PBN or BPMN2 at * p < 0.05, ** p < 0.01 y *** p < 0.001 (one-way ANOVA, followed by Holm–Sidak analysis as a post hoc test).

