Figure 4.

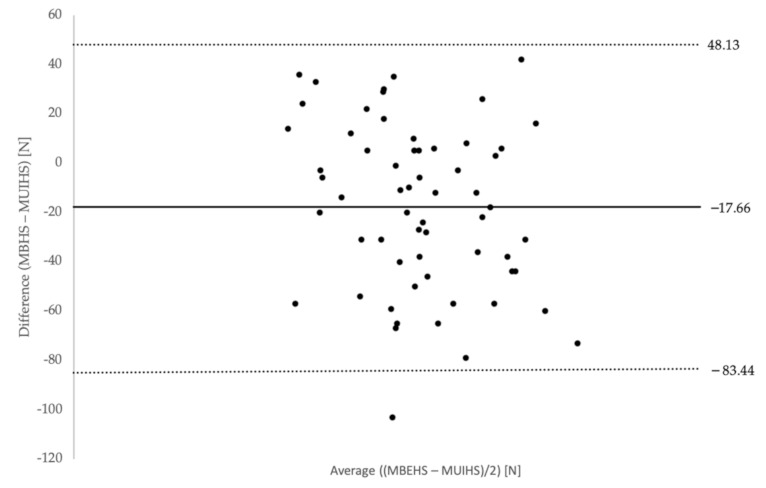
Bland–Altman plot of differences between MBEHS and MUIHS on the y-axis and mean of MBHES and MUIHS on the x-axis for the left leg (mean values and limits of agreement are plotted).

Bland–Altman plot of differences between MBEHS and MUIHS on the y-axis and mean of MBHES and MUIHS on the x-axis for the left leg (mean values and limits of agreement are plotted).