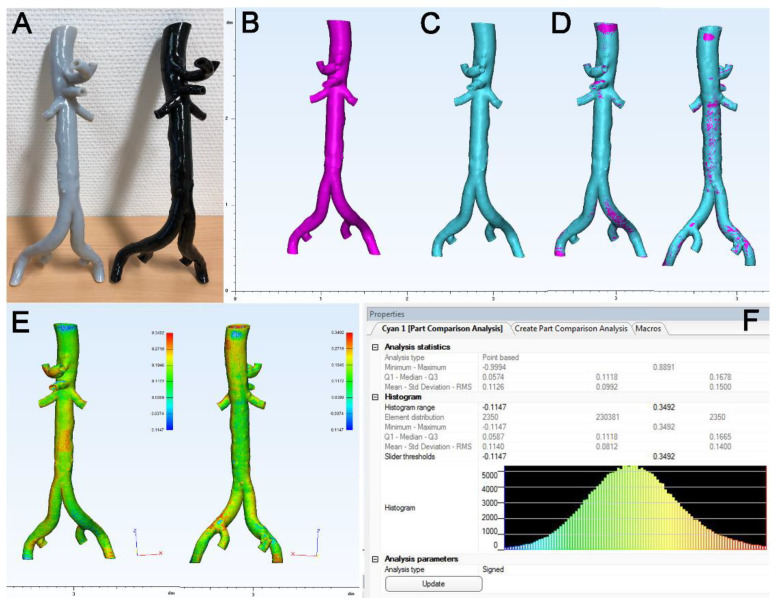
Figure 4.
Analysis of surface congruency of 3D model STL versus source STL. (A): Two representative models of abdominal aorta printed in flexible and rigid polymer. (B): The source STL (fuchsia) and (C): the STL of the 3D model (cyan) were imported in the 3Matic module of MIS and (D): both objects were brought to congruency using semi-automated alignment tools. (E): The part comparison analysis tool of the 3Matic shows a color-coded map of the object indicating the surface deviation between both objects in mm. (F): Histogram report of the results indicating the mean value of surface deviation.

