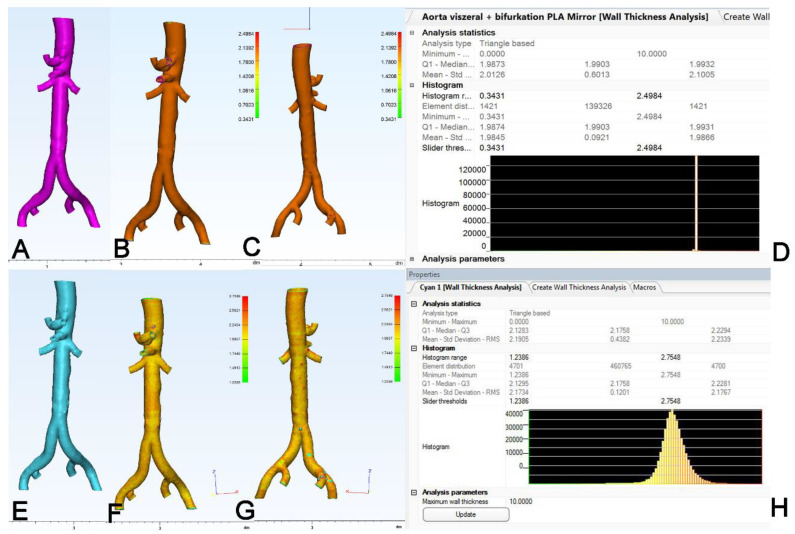
Figure 5.
Analysis of wall thickness of the 3D model. For internal validation, (A): the source STL was subjected to automated analysis of wall thickness. (B,C): Results of wall thickness analysis as a color-coded map of the object where (B): is the anterior view and (C): is the posterior view. (D): Histogram of wall thickness analysis (WTA) showing a sharp band at 1.99 mm. For the STL of the (E): 3D model, the results of WTA are shown as a color-coded map in (F): anterior view, (G): posterior view and (H): histogram.

