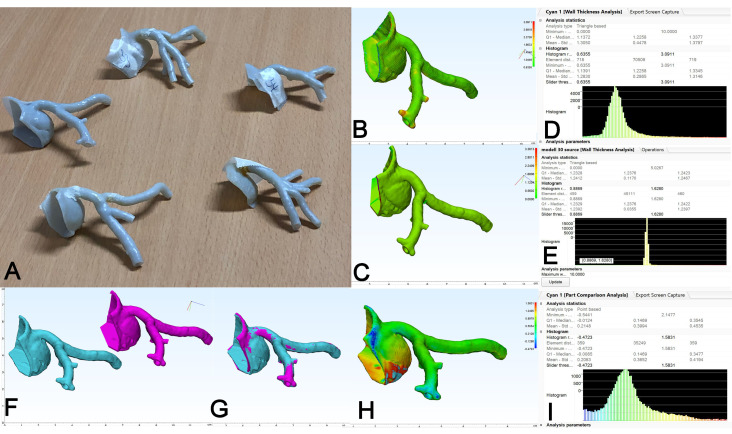
Figure 8.
Representative examination of 3D model of coronary arteries. (A): 3D models of five different configurations of coronary arteries were generated and printed in flexible polymer (Stratasys Tango® gray). (B): 3D model STL (cyan) and (C): source STL (fuchsia). (D): Color-coded map of WTA and histogram results of 3D model STL are shown. (E): Color map and histogram with sharp band of WTA of source STL for internal validation. (F): Source STL (fuchsia) and 3D model STL (cyan) were then semi-automatically aligned and overlayed (G). (H): Color map and (I): histogram results of PCA. Note surface deviation (hotspot) in yellow-red coding at coronary sinus.

