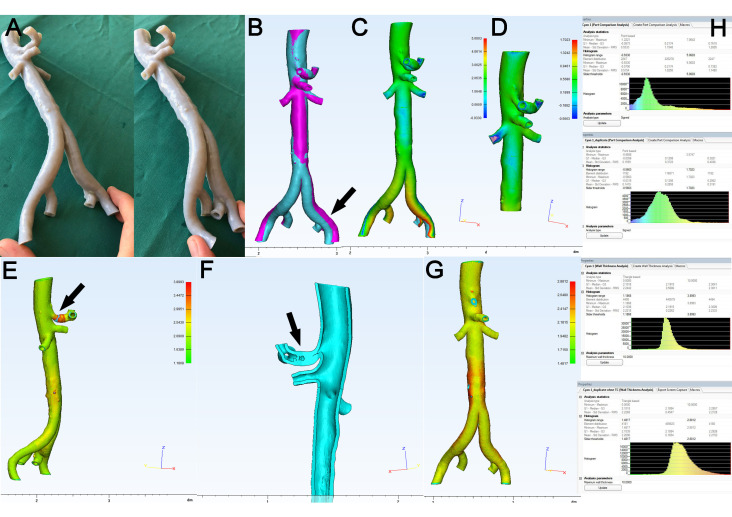
Figure 9.
Representative depiction of artifact analysis. (A): Demonstration of flexibility of 3D model of abdominal aorta (Stratasys Tango® gray). (B): Overlay of source STL (fuchsia) and 3D model STL (cyan) shows considerable surface deviation at left iliac axis (arrow). (C): PCA confirms hotspot at left iliac axis and mean deviation of 0.51 mm ((H), upper panel). (D): After removal of distal aorta, PCA shows uniform color map and mean deviation decreased to 0.14 mm ((H), upper middle panel). (E): Color map of WTA of abdominal aorta shows hotspot at the celiac trunk (arrow) caused by intraluminal remainders of support material in this hard-to-reach area, (F): anterior-posterior section (arrow). (G): For testing purposes, the celiac trunk was removed from the model and (H): mean wall thickness decreased from 2.22 to 2.20 mm (lower middle and lower panels).

