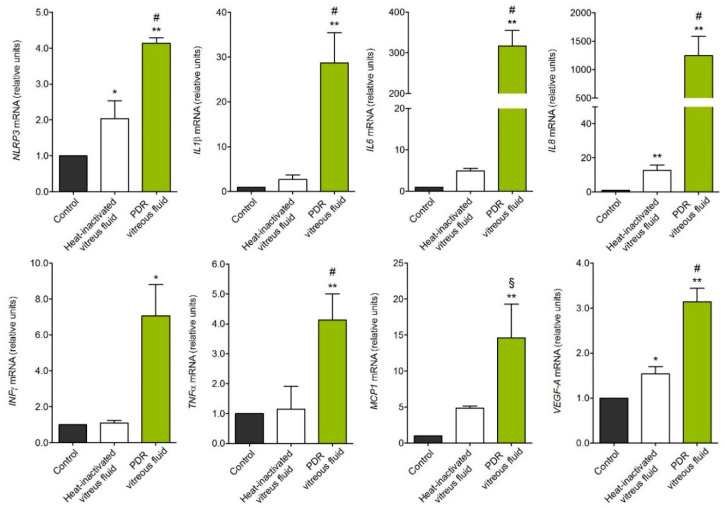
Figure 2.
Gene expression analysis of PDR vitreous-activated Müller cells. qPCR analysis of MIO-M1 cells treated with PDR or heat-inactivated vitreous samples. NLRP3, IL1β, IL6, IL8, INFγ, MCP1, and VEGF-A expression levels were assessed 4 h after treatment, whereas TNFα expression was evaluated at 8 h. Data are representative of 3 independent experiments in triplicate that gave similar results and are expressed as relative units in respect to control. * p < 0.05 and ** p < 0.01 vs. control; § p < 0.05 and # p < 0.01 vs. heat-inactivated vitreous, one-way ANOVA.

