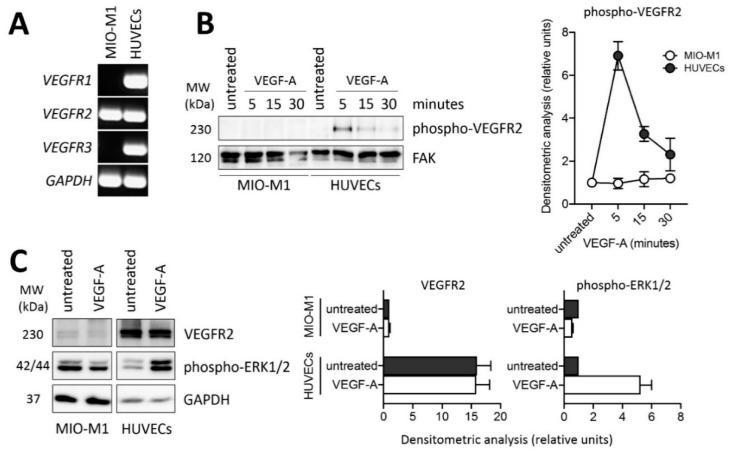
Figure 4.
VEGFR2 expression and lack of response in MIO-M1 cells. (A) Semi-quantitative RT-PCR analysis of VEGFR1, VEGFR2, and VEGFR3 expression in MIO-M1 cells and in human umbilical vein endothelial cells (HUVECs). Data are representative of 2 independent experiments that gave similar results. (B) Western blot analysis of VEGFR2 phosphorylation following 0–30 min of stimulation with 30 ng/mL VEGF-A in MIO-M1 cells and HUVECs. Densitometric analysis is shown in the right panel. Data are the mean ± SD of 2 independent experiments. (C) Western blot analysis of VEGFR2 protein levels and ERK1/2 phosphorylation following 10 min of stimulation with 30 ng/mL VEGF-A in MIO-M1 cells and HUVECs. Densitometric analysis is shown in the right and far right panel, respectively. Data are the mean ± SD of 2 independent experiments. MW, molecular weight.

