Figure 1.
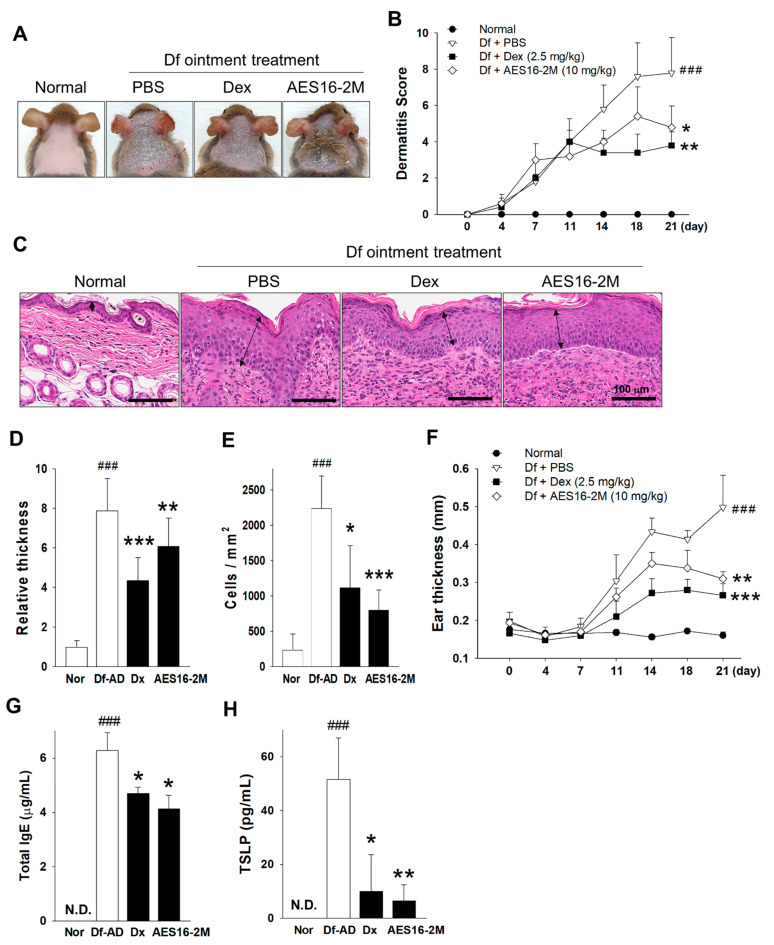
AES16-2M ameliorates Dermatophagoides farina (Df)-induced atopic dermatitis (AD). Df-induced AD was established as described in the Materials and Methods section. (A) The skin status was photographed on day 21. (B) The dermatitis score was compared between the AD mice and AES16-2M (10 mg/kg, S.C. injection) treated mice and summarized as mean ± SD (n = 10). Dexamethasone (Dex, 2.5 mg/kg) was used for the positive control group. (C) H&E stain of dermal tissues from day 21 was visualized by microscopy. Arrows reveal the epidermis. (D) The relative epidermal thickness was evaluated via data derived from (C) (three mice per group in quintuplicate). The thickness was measured using ImageJ and presented as mean relative values to the normal control. (E) Mononuclear cells that had infiltrated into the dermis were counted. (F) Ear thickness was measured using a digital caliper and was expressed as mean ± SD (n = 10). The total IgE (G) and TSLP (H) levels were evaluated from the sera of mice on day 21 (n = 5 for IgE, n = 3 for TSLP). The animal experiments were performed with a total of 10 mice per group. In the case of ELISA, sera from the dermatitis score-matched mice were used. A non-paired and two-tailed Student’s t-test was performed to compare the experimental groups and control groups. ###, p < 0.001 (vs normal); * p < 0.05 (vs PBS); ** p < 0.01 (vs. PBS); *** p < 0.001 (vs. PBS).

