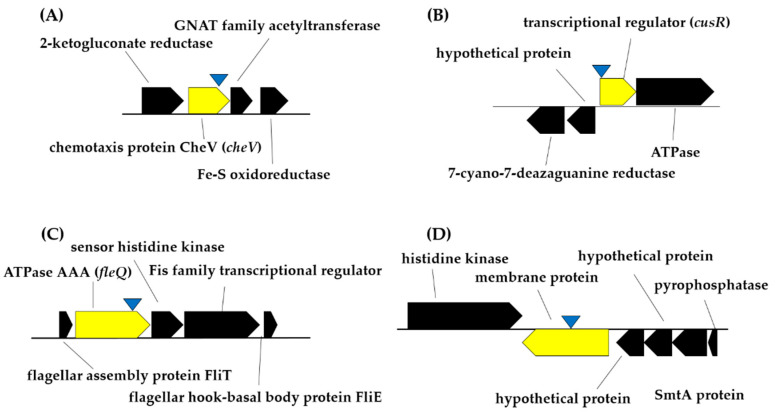
Figure 3.
Schemes representing the Tn5-TcR insertion sites (within genes shown in yellow color) in the genome of the Pseudomonas simiae PICF7 selected mutants. (A), Mutant Cop1; (B), Mutant Cop33; (C), Mutant Bfm8; (D), Mutant Bfm9. The approximate transposon insertion sites are shown as inverted blue triangles.

