Figure 2.
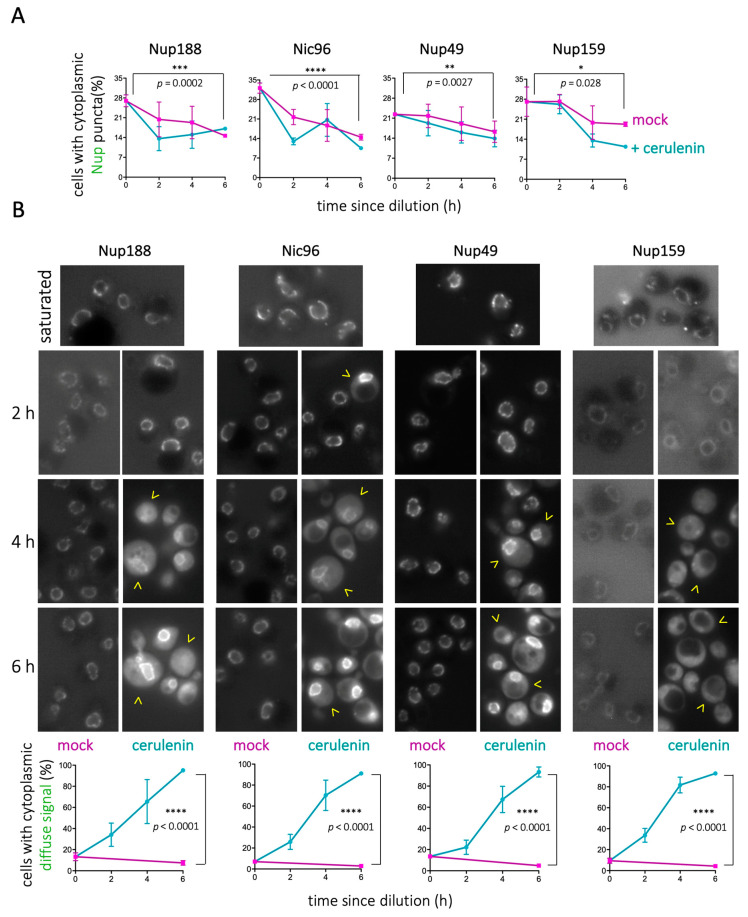
LD consumption by cerulenin dismantles cytoplasmic Nup puncta. (A) Overnight cultures grown in rich medium until saturation were diluted in the presence of 10 μg/mL cerulenin or in its absence (mock). Quantification showing the percentage of cells in the population displaying Nup cytoplasmic foci co-localizing with LD, for the indicated Nup, at the indicated culture timepoints. (B) top: Representative images of the timepoints described in (A). Yellow arrowheads point at cells in which the fluorescent signal becomes diffuse in the cytoplasm; bottom: Quantification showing the percentage of cells in the population in which Nup signals become diffuse in the cytoplasm. The data for each Nup are represented as an individual graph, in which timepoints correspond to the elapsed time since dilution in the presence of cerulenin or in its absence (mock). Each point is the mean value of three independent experiments. The significance of the difference of the means after applying a t-test is indicated by asterisks and P-values. Bars correspond to the SEM of those three independent experiments.

