Figure 5.
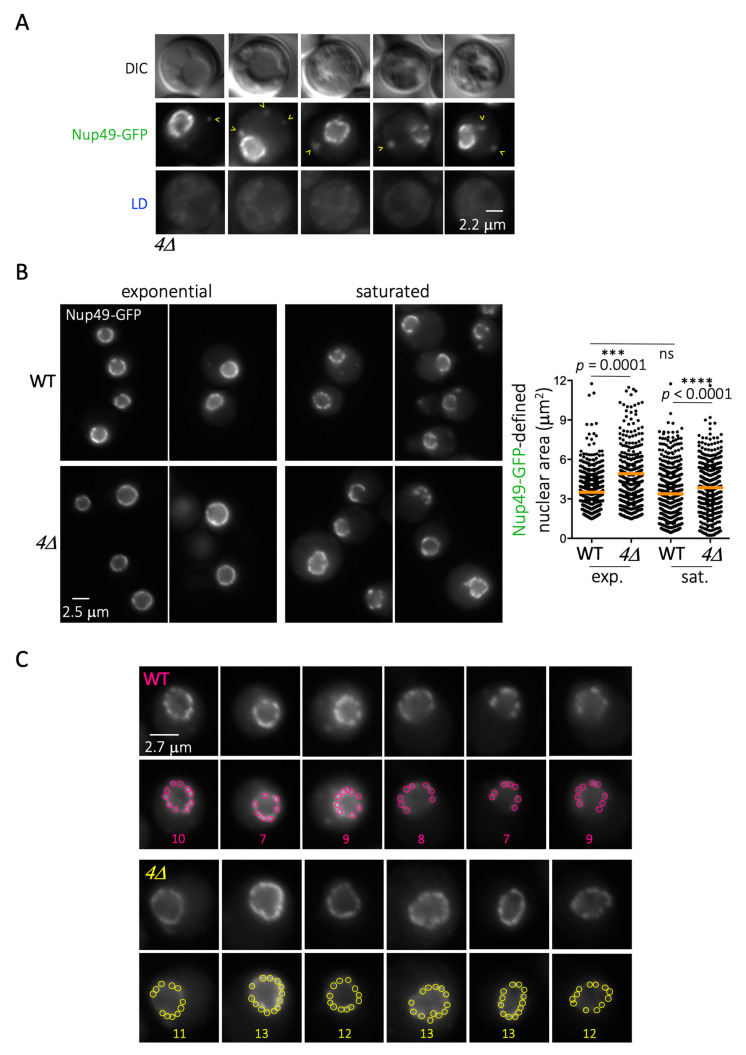
Inability to form LD triggers Nup overload at the nuclear envelope. (A) Fluorescence microscopy images of cells that cannot form LD (dga1Δ lro1Δ are1Δ are2Δ, simplified as 4Δ) in which Nup49 has been tagged with GFP. (B) left: Fluorescence microscopy images of WT and 4Δ cells in which Nup49 has been tagged with GFP, grown either to exponential phase or to saturation. right: Plot of the sizes of individual nuclear areas as defined by the Nup49-GFP rim for each strain for the indicated growth set-ups. Two independent experiments are included per condition in the plot. At least 300 cells were analyzed per condition and experiment. The orange bar indicates the mean of the population. The p values refer to the statistical significance of the difference of the means by t-test. (C) Images of individual nuclear rims of both WT and 4Δ cells from saturated cultures at the central plane only. For each strain, the upper row corresponds to the unprocessed image, while the lower row shows that same image, to which colored circles have been superimposed. Each circle comprises an NPC cluster, as identified following the directives presented in [34,35,59]. The numbers indicate the number of individual clusters identified for each nuclear rim.

