Figure 3.
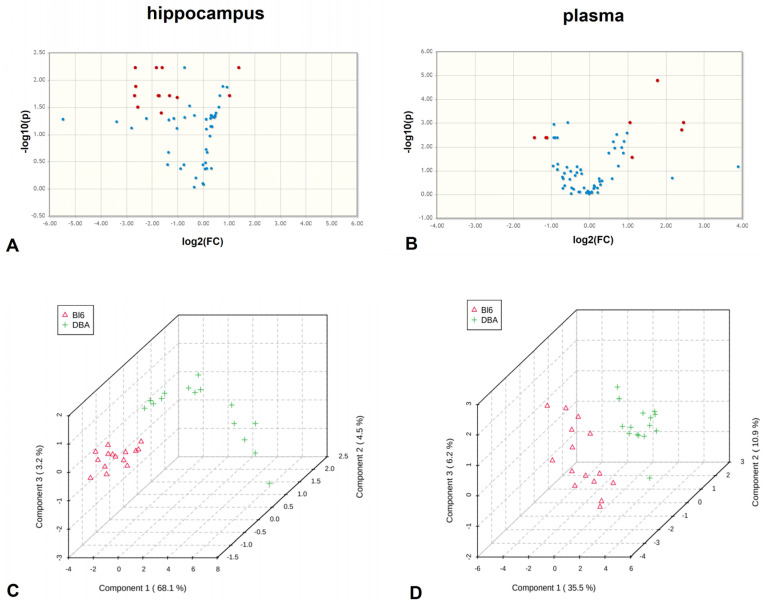
Divergent metabolite profiles for hippocampus and plasma in B6 vs. DBA mice. Volcano plots of significantly altered metabolite levels (false discovery rate (FDR)-corrected p < 0.05, unequal group variances) in hippocampus (A) and plasma (B) of B6 compared to DBA mice. Metabolites with B6/DBA fold change > 2, are highlighted in red and noted with * in Table 1. PLSDA analysis of hippocampus (C) and plasma (D) as shown by 3D score plots of B6 (Δ) and DBA mice (+). The explained variances are indicated in brackets (hippocampus: 68.1% for component 1, 4.5% for component 2 and 3.2% for component 3; plasma: 35.5% for component 1, 10.9% for component 2, and 3.2% for component 3) (n = 15 per group). FC: fold change.

