Figure 2.
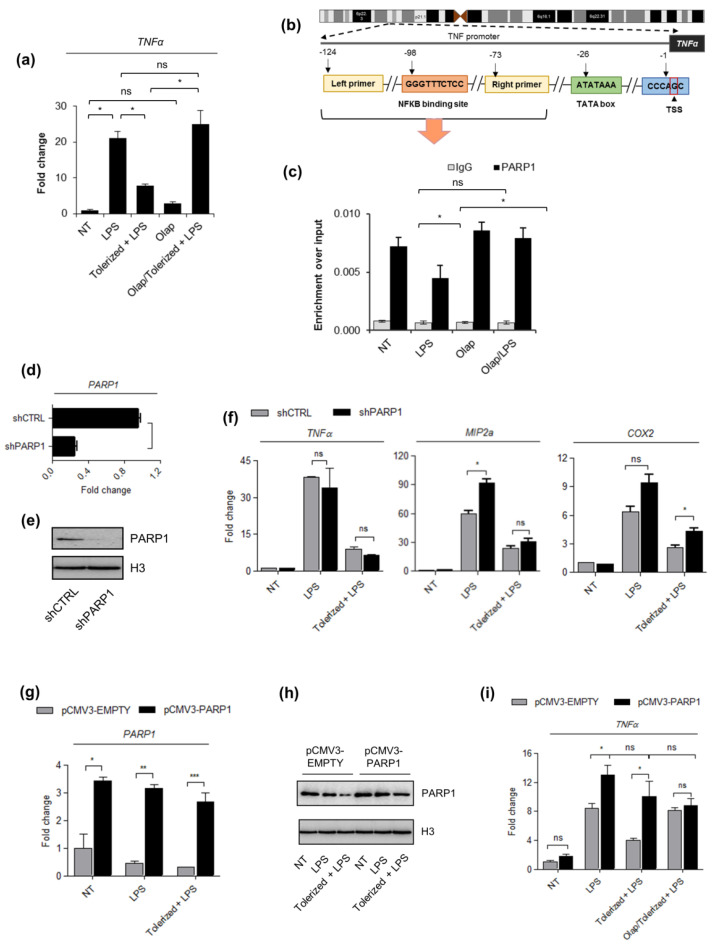
The PARP1 level drives LPS-induced immune paralysis in THP1 cells. (a) The induction of tolerance in acute leukemia cells was evaluated based on the TNF-α expression that was quantified by real-time PCR, normalized as median of ACTB and GAPDH, and shown as a fold change with respect to untreated cells. (b) The illustration in outlines the human proximal TNF-α promoter and the position of NF-κB (−98) as well as primer (forward: −124, reverse: −73) binding sites with respect to transcriptional start site (TSS). The fragment between the two indicated primers was amplified to quantify the immunoprecipitated DNA by real-time PCR. (c) The impact of the single LPS dose and olaparib on PARP1 occurrence at the TNF-α promoter was estimated with ChIP-qPCR. (d–e) The silencing efficiency of PARP1 in THP1 cells stably transfected with PARP-1 shRNA Plasmid was determined by real-time PCR and western blot, respectively versus corresponding control cells (shCTRL; control shRNA Plasmid-A). PARP1 mRNA was normalized to the median of ACTB and GAPDH, and shown as a fold change with respect to control cells with the normal PARP1 expression. In western blot, H3 was used as a loading control. Full-length western blot images are available in the Supplementary Figure S4. (f) The mRNA level of TNF-α, MIP2a, and COX2, which served to assess the development of immune tolerance in response to LPS, was measured with real-time PCR as described above. (g–h) PARP1 overexpression in pCMV3–PARP1 versus pCMV3–EMPTY-transfected cells was confirmed by real-time PCR and western blot, respectively. Full-length western blot images are included in the Supplementary Figure S5. mRNA level of PARP1 was normalized to ACTB and GAPDH and is presented as a fold change of PARP1 knock-in with respect to control cells. (i) The effect of PARP poison (olaparib) on the development of endotoxin tolerance in pCMV3–EMPTY and pCMV3–PARP1 cells was estimated on the basis of TNF-α transcription (mRNA), which was set as a readout. Bars in the figures represent mean ± standard error of the mean (SEM). One-way analysis of variance (ANOVA1) was carried out in GraphPad Prism 5 to compare means in several groups. Once the significance was detected, ANOVA1 was followed by the Tukey post-hoc test and significant differences between the two considered means are marked with * when significant at p < 0.05, ** when significant at p < 0.01, *** when significant at p < 0.001, ns—non-significant at p > 0.05. Abbreviations: THP1—human monocytic cell line, LPS—lipopolysaccharide, Olap—Olaparib, TNF—tumor necrosis factor, ACTB—actin beta, GAPDH—glyceraldehyde 3-phosphate dehydrogenase, shCTRL—THP1 cell transfected with Control shRNA Plasmid-A, shPARP1—THP1 cell transfected with PARP-1 shRNA Plasmid, pCMV3–PARP1—THP1 cells transfected with pCMV3–-PARP1 plasmid, pCMV3–EMPTY—THP1 cells transfected with pCMV3-EMPTY plasmid, IgG—immunoglobulin G.

