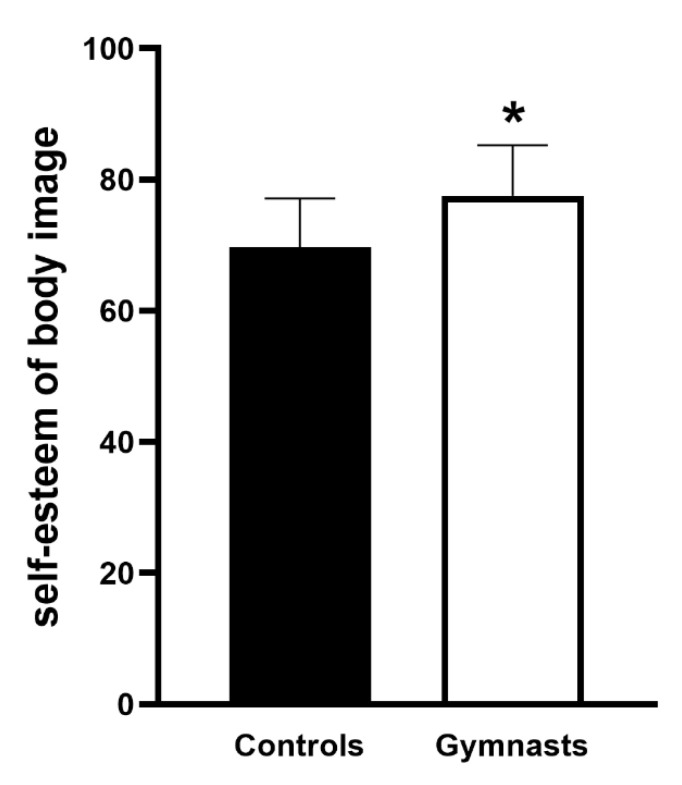
Figure 2.
Body image perception of the gymnast group (which included the gymnasts of both the HPM and HCM groups) compared with the control group (the control group consisted of sedentary peers). A subscale of the multidimensional test of self-esteem was used to analyze self-esteem of body image. Error bars depict SEM. Asterisks (*) depict statistically significant differences. Statistical significance is set at p < 0.05; n = 28 in each group.

