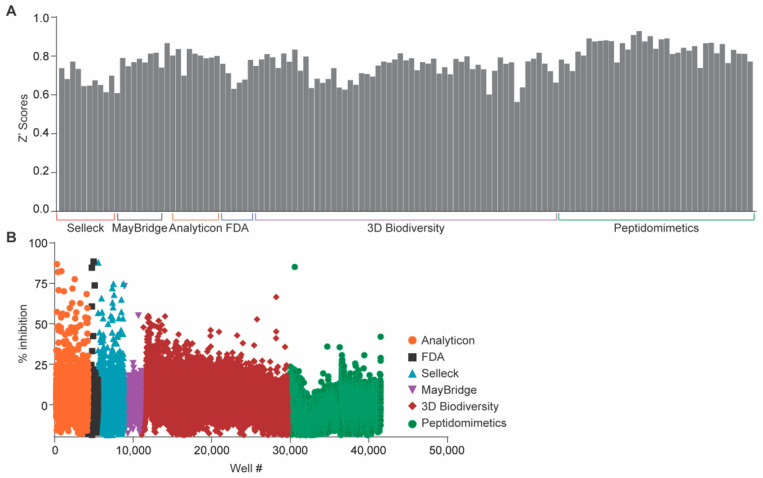
Figure 1.
Primary screening results. (A) Distribution of Z’ scores across all plates in NleB1 inhibition assays. An average z’-score of 0.77 +/− 0.08 was obtained, reflecting good separation between the distributions of the positive and negative controls among all assay plates. (B) High-throughput screening (HTS) results. The percentage of inhibition was calculated by computing the luminescence signals from UDP liberated from NleB activity. Inhibition was then plotted as a function of each compound per well number for all 42,498 targets in the combined libraries.

