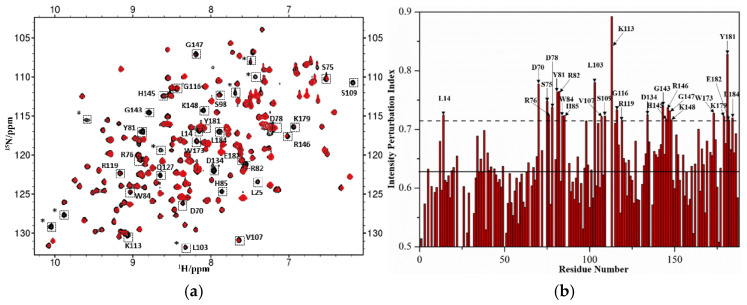
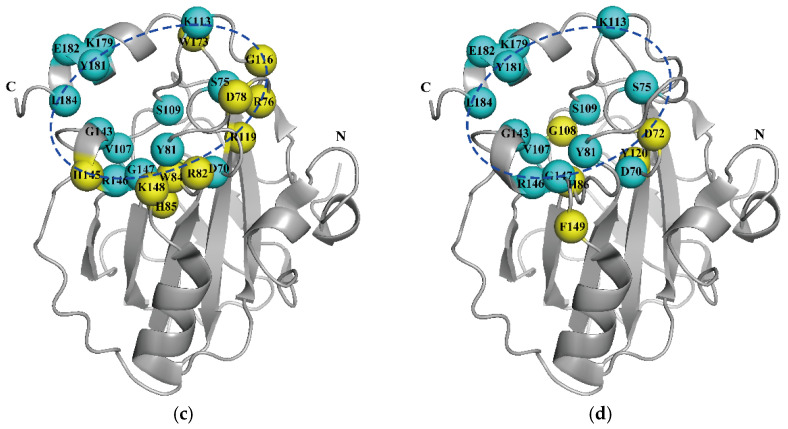
Figure 2.
Binding sites of suramin on hRKIP determined by nuclear magnetic resonance (NMR) spectroscopy (a) Overlaid 1H-15N HSQC spectra of hRKIP in the absence (black) and presence (red) of suramin at 1:1 molar ratio. * represents unassigned peaks from the residues located at the linker between target gene and the vector. (b) The intensity perturbation indexes versus residue number. Solid line: the average value of intensity perturbation index; Dashed line: average + SD. (c) Residues with significant broadened peaks are mapped to the solution structure of hRKIP (PDB: 2L7W). Dashed circle: the ligand-binding pocket of hRKIP. (d) Residues involved in the hRKIP- hRaf1NTD interaction are mapped to the same 3D structure [36]. Cyan balls: common residues involved in the interactions of hRKIP with both suramin and hRaf1NTD. Yellow balls: specific residues for the interaction of hRKIP with either suramin or hRaf1NTD.


