Figure 1.
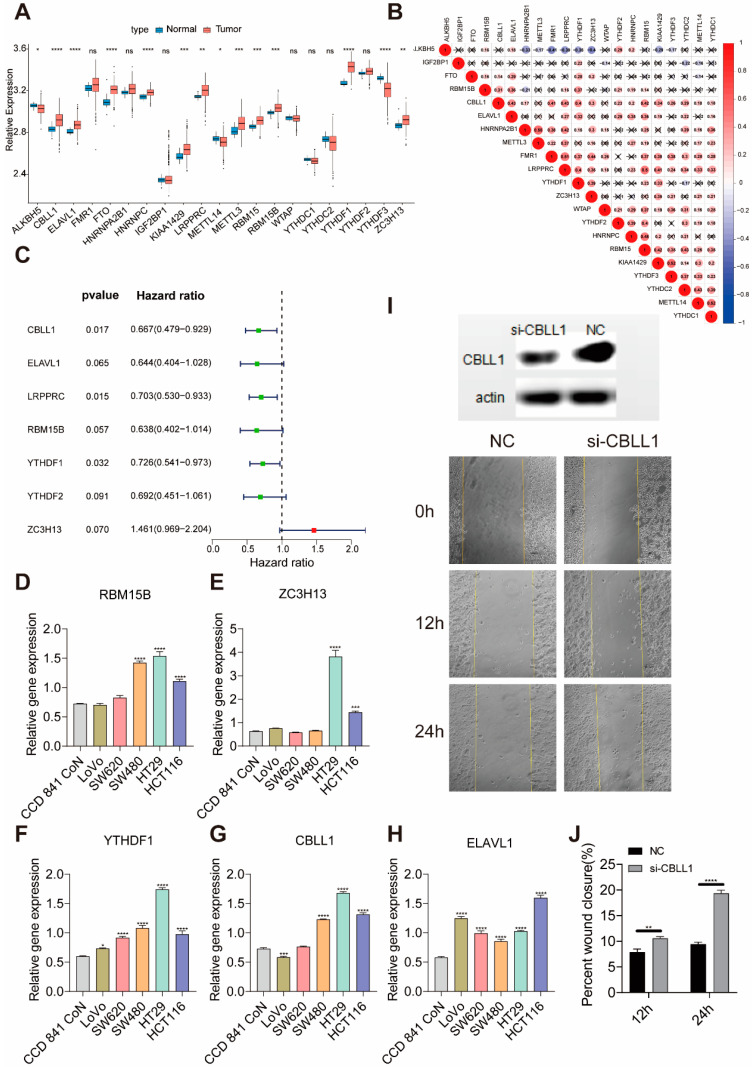
The expression of m6A regulators in colon cancer. (A) The expression of 21 m6A regulators between normal tissues and colon cancer tissues. Tumor, red; normal, blue. The upper and lower ends of the boxes represent the interquartile range of values. The lines in the boxes represent the median value, and the black dots show outliers. The asterisks represent the statistical p-value (* p < 0.05, ** p < 0.01, *** p < 0.001, **** p < 0.0001). (B) The interaction between m6A regulators in colon cancer. (C) The prognostic analysis for m6A regulators in colon cancer using a univariable Cox regression model. Hazard ratio >1 represents risk factors for survival and hazard ratio <1 represents protective factors for survival. (D–H) The expression of ELAVL1, RBM15B, ZC3H13, YTHDF1 and CBLL1 in different colon cell lines. (I) Western blot analysis of CBLL1 expression in HT29 cells treated for 72 h with CBLL1 siRNA(si-CBLL1) and negative control siRNA (NC), and knockdown CBLL1 promoted wound healing in HT29 cells (20× magnification) by scratch analysis in 0, 12 and 24 h. (J) Monitoring of cell migration showed that silencing CBLL1 expression by siRNA promoted migration ability in HT29 cells.

